 See Also
Netsweeper logging makes use of the Netsweeper LogMod 5.0 logging framework, which is a graph-based framework that provides a high level of flexibility.
This document describes some very simple configurations that can be used to solve a variety of common logging requirements. In general, these settings can be used as is or as a reference to build even more complex logging configurations to meet specific requirements.
LogMod 5.0 was introduced into the Netsweeper product in version 2.6.29.14 and later.
During normal operation, this is how the process flows:
- Log entries are queued up as they are generated.
- This queue is periodically emptied and the entries in the queue enter the LogMod5 graph as a packet (bundle) of entries.
- The packet starts at the lm5_entry node and moves through the graph via connections.
- The packet reaches an end point and is processed in a variety of ways.
- For example:
- Written to nslogger_request.log log files
- Sent to a remote logger
- Stored temporarily to be processed later
This diagram explains in a little more detail:
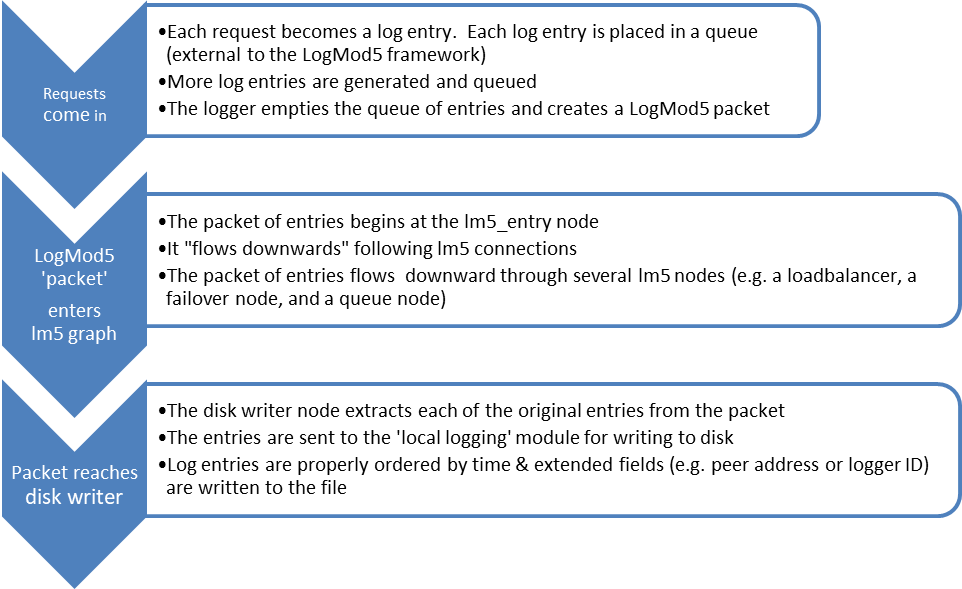
The LogMod 5 Graph
Nodes in a LogMod5 graph are specified and arranged inside the Policy Server Settings (nsd.conf) which is accessed through System Tools > System Configuration > Policy Server Settings in the WebAdmin. Specifying which nodes you want and how to connect and configure them is covered later.
The default configuration is a simple configuration that logs all entries to the local disk. By default, we will use a maximum of 5 gigabytes of disk space utilizing many log files that are required until this maximum is reached.
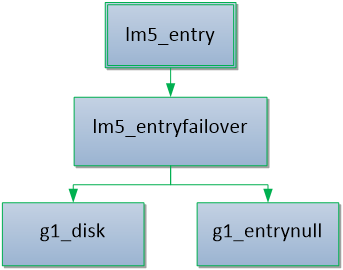
Graph Entry Points
Packets enter the graph and flow 'downwards' from starting points in the graph. In the examples above, the entry point is the node labeled lm5_entry. There is only one other kind of entry node that you can use, it is called lm5_remote_entry and it is explained later.
Graph Middle Nodes
Entry Point Packets usually flow through 'Middle Nodes'. Middle nodes usually have one entry connection from a node above, and one or more exit connections below. Inside the node, the packet usually undergoes some processing. Packets may be:
- routed – the node decides which exit connection (channel) to send the packet towards and then sends the packet to the node below connected on that channel
- copied – the node may accept packets from below and copy the packet to some or all of the nodes connected to its downstream channels
- split – some nodes might take the packet and break it into pieces and send some pieces to one channel and some pieces to another channel. It might even be programmed to simply discard some pieces of the packet
- stored – some nodes might behave as temporary endpoints, storing a packet for a short time and then sending it downstream later. (An example of this is the disk_queue node and the lm5_timer node, described later).
Graph End Nodes
Packets usually flow downwards through the graph without stopping until they reach an end node. End nodes have one (or more) entry channels and no exit channels. End nodes usually do things like:
- transmit packets over the network
- write packets to disk in the form of log entries
- discard entries, simply throwing them away
- count entries or collect other statistics
Examples of end nodes, described below, include the disk_writer, the tcpclient, and the devnull nodes.
Graph Examples
Here are a few examples of LogMod5 graphs:
Example 1
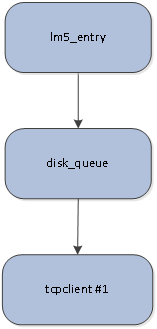
In this first graph, packets begin in the lm5_entry node, pass through the disk_queue node, and then are processed by the tcpclient #1 node.
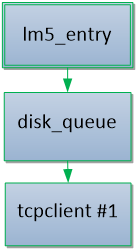
Example 2
In the second graph, packets flow through an lm5_mirror node which makes a copy of the packet and sends a copy to disk_writer and a copy to tcpclient #1
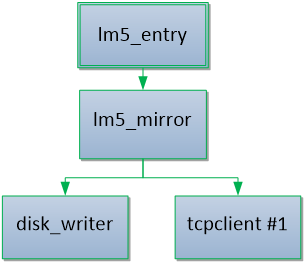
Example 3
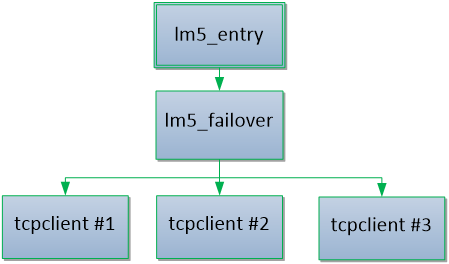
In the last graph, packets are first sent to tcpclient #1 but are sent to tcpclient #2 if there is any kind of error (for example if the remote logger is unavailable). If tcpclient #2 is also down or if there is some kind of error, then packets will be sent to tcpclient #3. If all three tcpclients are unavailable, then entries will not be logged anywhere. It is important to note that if failure occurs back to the lm5_entry node errors will be logged into the policy server’s error log file. We will discuss how to create a configuration which will fail open on failover later in this document.
Failure Modes
The LogMod5 framework has the ability to handle temporary (or permanent) errors or interruptions in service. Understanding failure behavior is essential to properly configuring a LogMod5 system.
Types of Failure Handling
There are three kinds of failures that the LogMod5 system is designed to handle:
- Packet failure
- Packet partial failure
- Node failure
Each of these is explained in detail in the following sections.
Packet Failure
As a packet is traveling downwards through the graph, any node along the way can decide to return either FAILURE or SUCCESS for the packet, or it can send the packet down one of its downstream channels and let some node below decide whether to return FAILURE or SUCCESS. When a result (of either FAILURE or SUCCESS) is decided, every node above that point will get a chance (in reverse order) to react to that result. A result of SUCCESS usually does not trigger any further action but, for some nodes, a result of FAILURE triggers special behavior.
The lm5_failover node is a good example on understanding how this works. The lm5_failover node, responds to packet FAILURE by sending the packet to its next downstream channel and trying again. The lm5_failover node responds to packet SUCCESS by not forwarding the packet to another channel, but simply returning the verdict of SUCCESS upstream. In this way, the lm5_failover node does exactly what you would expect: it sends all packets to a primary channel and routes packets to a backup channel (or channels) if/when there is a problem with any of those packets.
The details of what FAILURE actually means, why it occurs, and how it is handled is a matter of node semantics and will be different for every node. Refer to the 'Node Failure' section to learn how each node in a graph will handle FAILURE.
Packet Partial Failure
Partial failure, as described in the table of terminology, basically means that packet has returned FAILURE but in reality it was only a partial failure because some portion of the packet was processed successfully. How it was processed will be different from node to node, but in the case of LogMod5 request logging, it usually means that some of the log entries are successfully saved to disk and some of the entries are not (yet) successfully saved anywhere.
Partial failure is handled the same as normal packet failure and there is usually no way to really tell the difference between a partial or full failure. But, it is important to understand, that it is a capability of the LogMod5 system, that for many nodes it is handled as a special case, and it can sometimes cause surprises in behavior.
If a LogMod5 configuration is producing duplication or loss of entries, then it is usually a problem with partial failure and the graph should be considered carefully from the perspective of how partial failures will be handled.
Node Failure
Node failure is usually not as serious as it sounds. Node failure typically indicates a temporary condition has come up that prevents the node from handling any further packets. For example, the tcpclient node can enter the failed state in several different ways:
- It has not yet been able to make a connection with the remote server.
- The connection was lost (and the node is trying to re-establish it).
- The connection is ‘clogged’ because the tcpclient has sent more data than the remote system can handle or more than the network connection can handle. The failure state will go away when the ‘clog’ is cleared and the remote system is ready to process more data.
These are examples of node failure in the tcpclient node. Nearly all of the LogMod5 nodes will have some kind of failure mode. The disk writer node might report a failure when its disk is full or if its files cannot be written for some reason.
Node failure is quite different from packet failure. It is possible and common for node failure to happen without any packet failure and sometimes an individual packet failure happens without node failure. Refer to node descriptions to learn how each of these conditions can occur in each type of node.
End point nodes are not the only kinds of nodes that might go into a ‘failed state’. Nodes in the middle of the graph can also enter the failed state. For example, the lm5_failover node will enter the failed state if all of its connected downstream node instances are reporting failure. A disk queue node will report failure if its downstream node is failed and if its internal disk is full or has reached its configured size limit.
Node failure is logmod5’s primary means of ensuring that log entries flow smoothly, that no data is lost, and that there is no system hanging (causing difficulty shutting down or temporary slowdowns in service).
A Node Failure Analogy
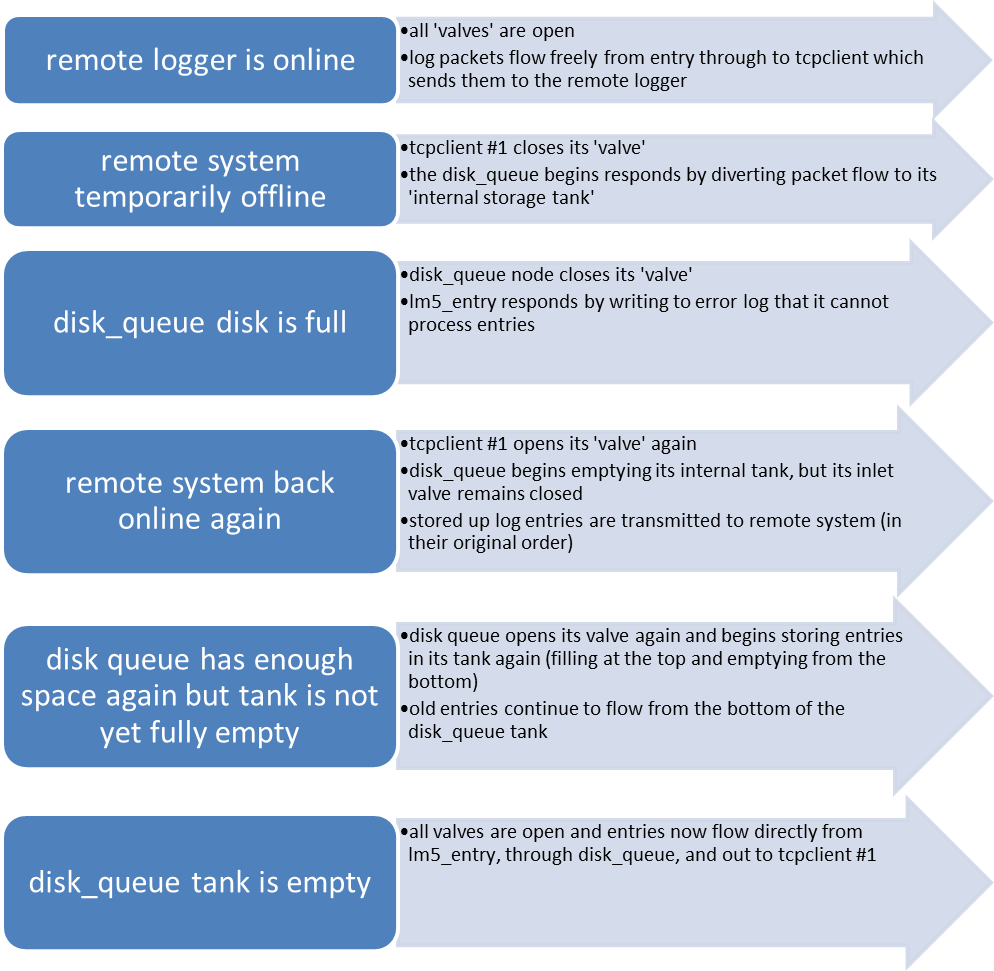
If you think of a graph as a vertical system of pipes and joints, and you think of the flow packets downward through the pipes as the flow of water, you can think of node failure as simply a closing of a valve above a node. When a node is not able to process information (no matter how long or short this state lasts), the node 'closes the valve' and this prevents water flowing in. With the valve closed, nodes immediately above that must make a decision to divert the water to a different downstream channel, to simply become a dead end, to turn off their own upstream valve, or in the case of some middle nodes (such as the disk_queue node) to become like a 'water tank' storing up packets until either the tank is full or the valve below is opened again.
Failover Graph Examples
Failover between three remote loggers
In this graph an lm5_failover node reroutes packet flow to the next working tcpclient, if/when a remote logger goes offline.
- All remote loggers online: Log entries flow from lm5-entry through failover to tcpclient #1.
- Remote Logger #1 goes offline: tcpclient #1 closes its 'inlet valve; failover diverts flow to tcpclient #2
- Remote Logger #2 goes offline: tcpclient #2 turns off its 'inlet valve'; failover diverts flow to tcpclient #3; packets continue to flow and are now handled by tcpclient #3
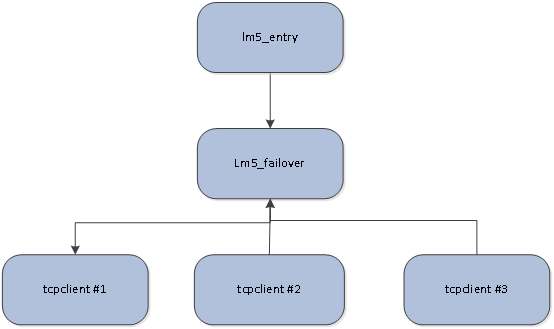
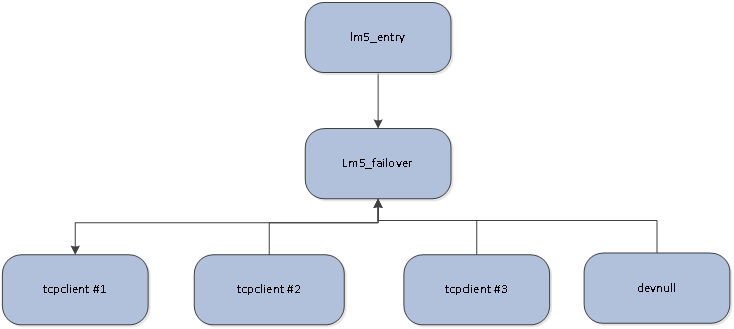
In the above graph it is important to note that if all three tcpclients go offline, the lm5_failover node will also go into a failover state. This will report back to the lm5_entry node a failure case. This will start to log error messages into the policy server error log file whenever a group of log entries is processed and discarded. To avoid having the policy server error log fill up or by ignoring failures of this sort, it is possible to add a devnull node in the failover three. The devnull node will never fail and simply consume all entries.
Failover To Devnull Node To Avoid Error Logging
Tcpclient Node with disk_queue “temporary storage”
In this graph a disk_queue node acts as a “tank” and stores packets whenever the tcpclient node turns off the valve.
Two remote loggers with timer
In this interesting example, a timer node is used to schedule usage of a remote server. If we have a production situation where there are two remote logging systems, one of which is to be used during the hours of 9am – 5pm and the other to be used during all other hours of the day, we can use a timer node to make it all happen.
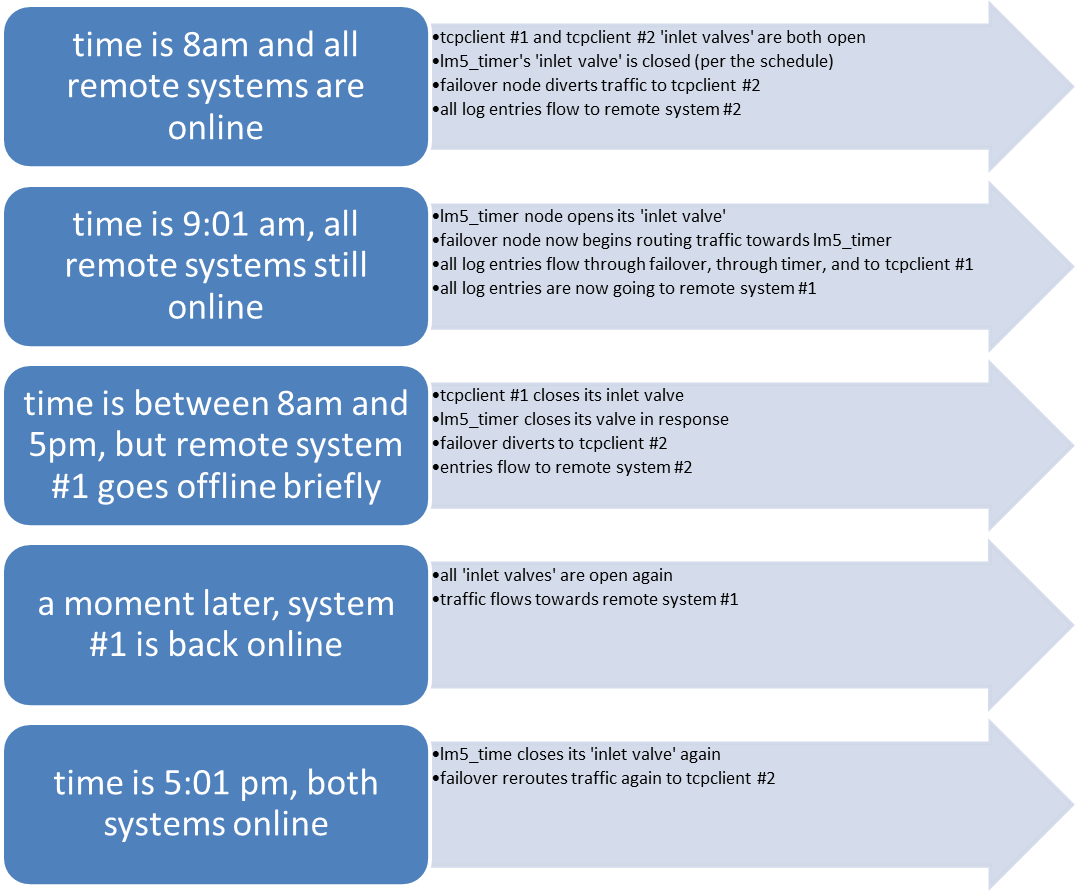
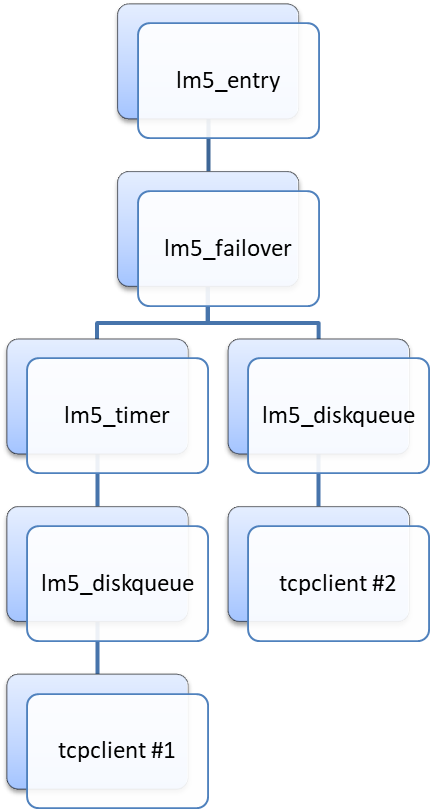
In this example, notice that disk_queue nodes could be added to immediately above the tcpclients in order to ensure that log entries go to the intended destinations at the indented times. Without any disk_queue nodes, you will still send entries to remote system #2 in the case of an outage to remote system #1 during the 9-5 window when entries are intended to go to remote system #1.
Two remote loggers on Schedule with Disk Queues before TCPclient
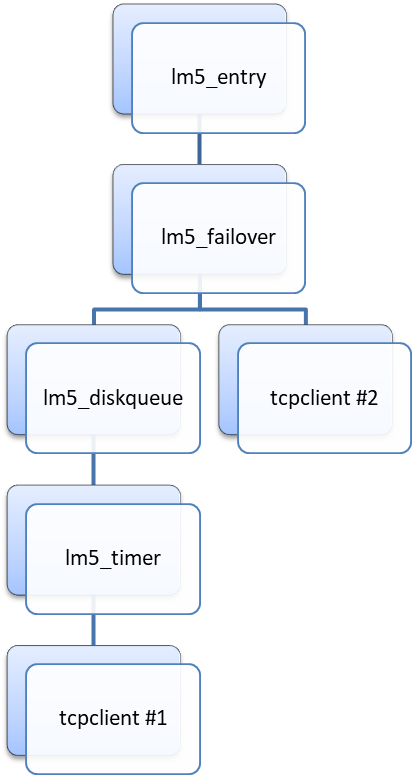
Also, what would happen if you put a disk queue above the timer instead of below it? In that case you would actually store all log entries during off hours and then transmit them all during the 9-5 window. Failover to tcpclient #2 would only happen when the disk queue failed, for example, because local disk space was entirely consumed.
Transfer of Logs to One System, if disk queue errors failover to another remote system
Configuring LogMod5 in the Policy Server
This section describes the relevant settings in Policy Server configuration, nsd.conf file, and how to get set up using LogMod5. By default, when you upgrade to the 2.6.29.14 release you will be already using the LogMod5 framework. Check the bottom of the configuration file for the specific information in regard to the LodMod5 graph configured on your system.
Configure Logger
The logger module is a ‘legacy’ system predating logmod5. The logger module is used directly by all the policy server request threads that are servicing individual requests for policy rulings, remote logging requests, etc. When a request thread has a new log entry to record, it sends it to the logger module. The logger module places it in a queue of log entries. Once the log entry queue reaches a certain size or once a certain amount of time has passed (a fraction of a second), the queue is processed by sending it to a processing framework.
Prior to logmod5, the processing frameworks available were:
- local – a module which writes log entries to the local disk as nslogger_request*.log files
- remote – a module which transmits log entries to a configured remote system
With LogMod5 included in the policy server, a new framework is added. The oldframeworks are still available however. There are now two new frameworks available (both essentially pointing to the same thing):
- LogMod5 – a module which routes log entries into a LogMod5 packet and gives this packet to the lm5_entry node
- logmod5_remote – a module which routes log entries into a LogMod5 packet and gives this packet to the lm5_entry_remote node
All logger nsd.conf settings are as they were before. This includes any setting that begins with the word 'logger_' but which does not begin with the word logger_local or logger_remote. (All the settings for logger_local and logger_remote will no longer apply).
Although you can list multiple handlers here (separated by commas) you should not use both LogMod5 and local at the same time. This is because they both register to the same SNMP OIDs and will conflict, causing your SNMP to not work properly.
Configure LogMod5
Once the LogMod5 framework is enabled by specifying LogMod5 as a processing framework (as described above), you must configure LogMod5. Configuring LogMod5 is done a little differently from most other settings in the policy server. Configuring LogMod5 is done in three sections:
- Instantiate nodes – by specifying node types followed by node names, you instantiate named instances of all the nodes you need in your graph(s). If you require multiple instances of a node, simply specify the node type again on another line in nsd.conf and give the second instance a different node name. Node names must be unique across the entire nsd.conf file.
- Make connections – Connections are made in the graph one connection at a time. Each graph connection is defined on a new line in the nsd.conf. Graph connections are defined with ‘logger_logmod5_connect’ followed by the node name of the upper node, followed by the name of the lower node. The order of the lines in nsd.conf will set the order of the channels for each node, and this generally determines the channel priority. So, for connections where priority matters (such as with failover, where you have a first priority channel, followed by a second, and a third, etc), be sure to specify your highest priority connection first in the nsd.conf.
- Provide node parameters – most (but not all nodes) will require some parameters for configuration. In the case of the tcpclient node, this includes at least the remote host name and the remote port number. Parameters are provided in this format: node_parameter_name value.
Look at an example configuration:
lm5_entry entry_point
lm5_disk_queue tmp_que
lm5_tcpclient remote_connection
logger_logmod5_connect entry_point tmp_que
logger_logmod5_connect tmp_que remote_connection
tmp_que->file_path /tmp/
tmp_que->file_prefix nsd_temporary_quefile
tmp_que->max_disk_size 10G
tmp_que->max_disk_size_thresh 100K
tmp_que->num_files 10
remote_connection->remote_logger_host 192.168.4.64
remote_connection->remote_logger_port 3000
With the setting below, the local logger will send log entries of 2 types to the logger:
- Old logger (3.0.8.0 and below) only supports 255 categories. 0 (zero) indicates limited categories supported by the remote logger.
- New logger (3.0.9.0 and up) that support unlimited categories. 1 indicates unlimited categories supported by the remote logger.
remote_connection->unlimited_cats 0
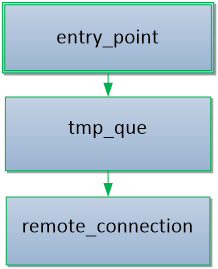
Example: Three Nodes are Instantiated
In this example, three nodes are instantiated (a lm5_entry node, a lm5_disk_queue node, and an lm5_tcpclient node) and these nodes are given meaningful and unique names. Below this the two connections are made, forming a straight “tree” with entry point connected to queue connected to TCP below that. Finally, each node receives its configuration parameters by specifying the name of the node, the parameter, and its value.
Creating Multiple Graphs in the same nsd.conf
As described above, in the section about the Logger, it is possible to have separate graphs for the remote and the local entries. Creating a separate graph is done by instantiating all the nodes you need for both graphs, specifying connections (for both graphs), and then configuring all the nodes. In other words, there’s nothing special about it. Except, you have nodes that have no connection to each other. As a result, you will have two independent graphs.
LogMod5 Quick Start Examples
You can copy or adapt one of these example configurations in order to get up and running easily.
Quick Start - Example 1
In this first example, we send all log entries for the "default" group to one log file and all others to a different log file:
lm5_entry entry_point
lm5_group_filter dflt_filter
lm5_diskwriter dflt_writer
lm5_diskwriter other_writer
logger_logmod5_connect entry_point dflt_filter
logger_logmod5_connect dflt_filter dflt_writer
logger_logmod5_connect dflt_filter other_writer
dflt_filter->filter default
dflt_writer->max_file_size 1G
dflt_writer->max_file_count 5
other_writer->max_file_size 1G
other_writer->max_file_count 5
Quick Start - Example 2
The second example will log all entries to a remote server. If there is an interruption in the network connection, log entries will be saved temporarily on the local hard drive and copied over automatically when the network connection is restored.
lm5_entry entry_point
lm5_disk_queue tmp_que
lm5_tcpclient remote_connection
logger_logmod5_connect entry_point tmp_que
logger_logmod5_connect tmp_que remote_connection
tmp_que->file_path /tmp/
tmp_que->file_prefix nsd_temporary_quefile
tmp_que->max_disk_size 10G
tmp_que->max_disk_size_thresh 100K
tmp_que->num_files 10
remote_connection->remote_logger_host 192.168.100.99
remote_connection->remote_logger_port 3000
Quick Start - Example 3
In the third example, we introduce a timer node to the queue and TCP configuration. The timer node can be used to effectively make the TCP node appear to be offline for certain periods (causing everything to be queued to disk during that time). This is useful if you would like to use nighttime bandwidth to transmit log entries (from the previous day) and not transmit any log entries during the day (just save them to be sent later). Nighttime will be 8pm -> 6am every day. Also, note that the timer will not interfere with the tmp_que's ability to handle real network outages during nighttime transmission. If the TCP connection goes offline then the disk queue will still queue up entries until the TCP connection is restored.
lm5_entry entry_point
lm5_disk_queue tmp_que
lm5_timer night_timer
lm5_tcpclient remote_connection
logger_logmod5_connect entry_point tmp_que
logger_logmod5_connect tmp_que night_timer
logger_logmod5_connect night_timer remote_connection
tmp_que->file_path /tmp/
tmp_que->file_prefix nsd_temporary_quefile
tmp_que->max_disk_size 1G
tmp_que->max_disk_size_thresh 100K
tmp_que->num_files 10
night_timer->schedule 20:00 06:00
remote_connection->remote_logger_host 192.168.100.99
remote_connection->remote_logger_port 3000
Quick Start - Example 4
In the fourth example, we split logging entries up using a hash. To do this you can either use one of the hashing nodes (or any combination of hashing nodes) or you can do, as in this example, and use the macro node which makes it very simple to configure any n-way hash to the disk. In this example, we make a 32-way hash by URL. This will create 32 different log files.
lm5_entry entry_point
lm5_hash_macro hash_mac
hash_mac->hash_type url
hash_mac->hash_size 32
logger_logmod5_connect entry_point hash_mac
Quick Start - Example 5
In the last example, we load balance (round robin) log entries between three different remote servers (note, if one connection fails then entries will automatically divert to the next available connection):
lm5_entry entry_point
lm5_lb_rr balancer
lm5_tcpclient remote1
lm5_tcpclient remote2
lm5_tcpclient remote3
logger_logmod5_connect entry_point balancer
logger_logmod5_connect balancer remote1
logger_logmod5_connect balancer remote2
logger_logmod5_connect balancer remote3
remote1->remote_logger_host 192.168.100.100
remote1->remote_logger_port 3000
remote2->remote_logger_host 192.168.100.101
remote2->remote_logger_port 3000
remote3->remote_logger_host 192.168.100.102
remote3->remote_logger_port 3000
Default 2.6.29.14 Configuration with No Remote Logging
The default configuration is a very simple configuration that logs all log entries to the local disk. By default we will use a maximum of 5 gigabytes of disk space utilizing many log files that are required until this maximum is reached.
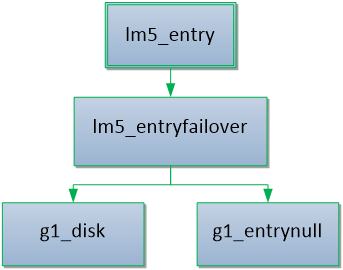
The above configuration is represented in the configuration file with the following policy server configuration specifications.
lm5_entry g1_entry
lm5_failover g1_entryfailover
logger_logmod5_connect g1_entry g1_entryfailover
lm5_diskwriter g1_disk
logger_logmod5_connect g1_entryfailover g1_disk
lm5_devnull g1_entrynull
logger_logmod5_connect g1_entryfailover g1_entrynull
All modules in this case will be using the default configuration settings.
If you wish to specify new settings for the amount of disk space the g1_disk can use, you would need to add the following configuration values:
g1_disk->max_disk_usage_size 100 gbytes
For a complete specification of each node type and the configuration settings, please refer to the “Appendix: Node Definitions” section at the end of this document.
Logging configurations should be configured once at deployment time. Log files might be orphaned in the event that configuration changes are made to a production system. Whenever modifying the logging configuration, you must be certain that old log files are renamed or manually removed.
There will be log files orphaned if the disk writer node name is modified, or the log file type is modified.
Please consult with your Netsweeper Systems Engineer, prior to altering logging configurations for production systems.
Default Remote Logging Upgrade
During an upgrade to 2.6.29.14, if you had a remote logging server configured, the following configuration will be used once you upgrade to the new release of the Netsweeper product. You should verify after upgrade that the following configuration is present for all policy servers logging to remote servers. It is important to note there are two graphs created. One graph to send logs to the remote server and another that will save logs sent from a remote server locally. By default previous releases did not distinguish between locally generated policy requests and requests from remote servers. With LogMod5 you cannot store remote log requests to different files.
Simple Example LogMod5 Graphs
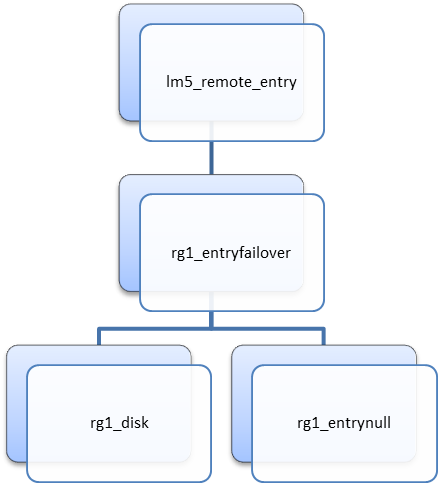
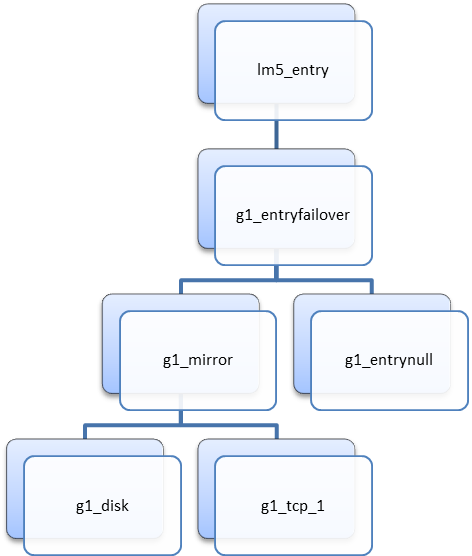
The following configuration will be created in the policy server configuration, nsd.conf file, when upgrading to the 2.6.29.14 release.
lm5_entry_remote rg1_entry
lm5_failover rg1_entryfailover
logger_logmod5_connect rg1_entry rg1_entryfailover
lm5_diskwriter rg1_disk
logger_logmod5_connect rg1_entryfailover rg1_disk
lm5_devnull rg1_entrynull
logger_logmod5_connect rg1_entryfailover rg1_entrynull
lm5_entry g1_entry
lm5_failover g1_entryfailover
logger_logmod5_connect g1_entry g1_entryfailover
lm5_mirror g1_mirror
logger_logmod5_connect g1_entryfailover g1_mirror
lm5_diskwriter g1_disk
logger_logmod5_connect g1_mirror g1_disk
lm5_tcpclient g1_tcp_1
logger_logmod5_connect g1_mirror g1_tcp_1
lm5_devnull g1_entrynull
logger_logmod5_connect g1_entryfailover g1_entrynull
g1_tcp_1->remote_logger_port 3000
g1_tcp_1->remote_logger_host 192.168.1.123
Multiple Remote Servers
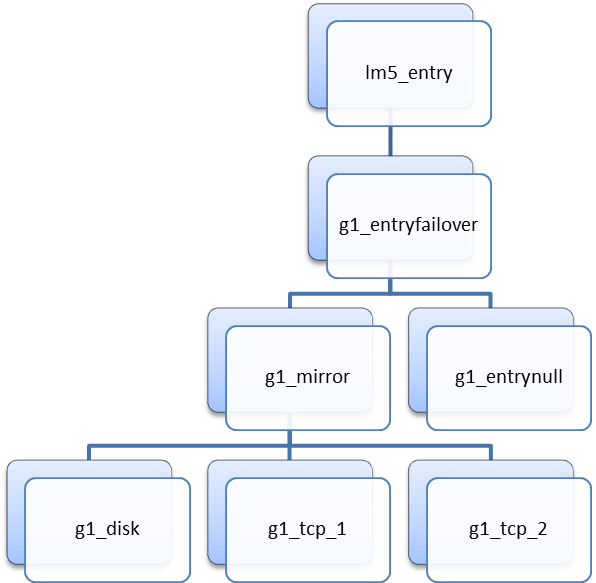
The above configuration can be modified for more remote servers by adding more tcpclient nodes after the mirror node. For example, the following could be added to the above configuration to add another tcpclient node that logs entries to another remote server.
lm5_tcpclient g1_tcp_2
logger_logmod5_connect g1_mirror g1_tcp_2
g1_tcp_2->remote_logger_port 3000
g1_tcp_2->remote_logger_host 192.168.2.222
The following graph would represent the complete above configuration for the lm5_entry. You can see that the g1_tcp_2 has been added to the mirror node.
Removing the Local Disk Logging on Policy Server installations
In the above examples, all data was logged locally on each policy server instance and also mirrored to a remote logging server. For performance reasons you may wish to remove the local logging aspect since these logs are only used for support, troubleshooting and diagnostic purposes.
Only remote logging to one server:
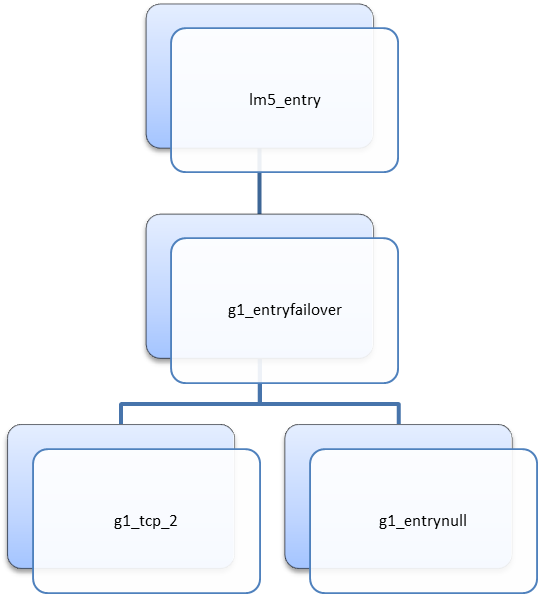
The configuration for the above example is rather simple since only the disk entry is removed. For the lm5_entry graph, the following configuration could be used. Please be advised this example does not include the logger_remote_handlers and the logmod5_remote_entry.
lm5_entry g1_entry
lm5_failover g1_entryfailover
logger_logmod5_connect g1_entry g1_entryfailover
lm5_tcpclient g1_tcp_1
logger_logmod5_connect g1_entryfailover g1_tcp_1
lm5_devnull g1_entrynull
logger_logmod5_connect g1_entryfailover g1_entrynull
g1_tcp_1->remote_logger_port 3000
g1_tcp_1->remote_logger_host 192.168.1.123
Guaranteed Remote Logging Configurations
One of the main advantages and features of the LogMod5 framework is the ability to guarantee log file delivery. This is completed by adding the diskqueue node in the appropriate place in the graph. Generally, this node should be used before a tcpclient node.
Guaranteed log file delivery to remote server:
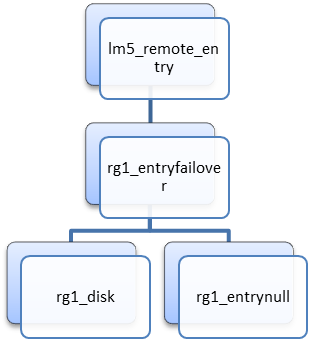
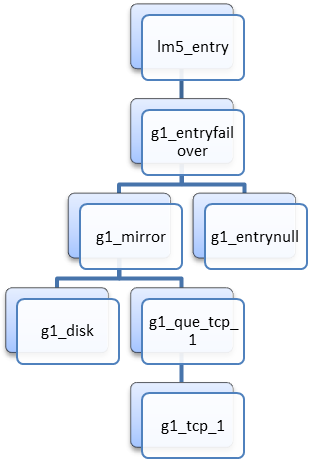
The following configuration will build the complete configuration illustrated above. This is very similar to the remote logging example with the addition of the g1_que_tcp_1 node which will queue failed log entries sent to the tcpclient node g1_tcp_1.
lm5_entry_remote rg1_entry
lm5_failover rg1_entryfailover
logger_logmod5_connect rg1_entry rg1_entryfailover
lm5_diskwriter rg1_disk
logger_logmod5_connect rg1_entryfailover rg1_disk
lm5_devnull rg1_entrynull
logger_logmod5_connect rg1_entryfailover rg1_entrynull
lm5_entry g1_entry
lm5_failover g1_entryfailover
logger_logmod5_connect g1_entry g1_entryfailover
lm5_mirror g1_mirror
logger_logmod5_connect g1_entryfailover g1_mirror
lm5_diskwriter g1_disk
logger_logmod5_connect g1_mirror g1_disk
lm5_disk_queue g1_que_tcp_1
logger_logmod5_connect g1_mirror g1_que_tcp_1
lm5_tcpclient g1_tcp_1
logger_logmod5_connect g1_que_tcp_1 g1_tcp_1
lm5_devnull g1_entrynull
logger_logmod5_connect g1_entryfailover g1_entrynull
g1_que_tcp_1->file_path /usr/local/netsweeper/logs
g1_que_tcp_1->file_prefix disk_queue_g1_que_tcp_1
g1_que_tcp_1->max_disk_size 10G
g1_que_tcp_1->max_disk_size_thresh 100K
g1_que_tcp_1->num_files 10
g1_tcp_1->remote_logger_port 3000
g1_tcp_1->remote_logger_host 192.168.1.123
It is recommended to always specify the file sizes for all node elements when possible. This will make sure after an upgrade the configuration will remain the same. Sometimes default values will change and may cause issues after an upgrade. The example above sets the disk queue node to use 10 gigabytes of disk space in 10 files.
If there is a system failure that consumes all this space, the disk_queue node will fail. This will proceed to make the mirror node fail, and the log entries will be sent to devnull, and no errors will be reported in the policy server error log. This may not be the desired effect, and you may wish for errors to be logged. If this is the case, you can remote the failover node and the devnull node to create a simpler graph.
Guaranteed log file delivery to remote server:
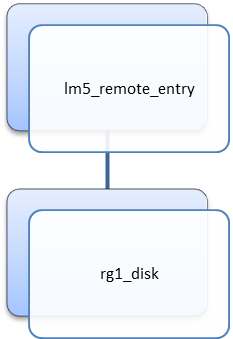
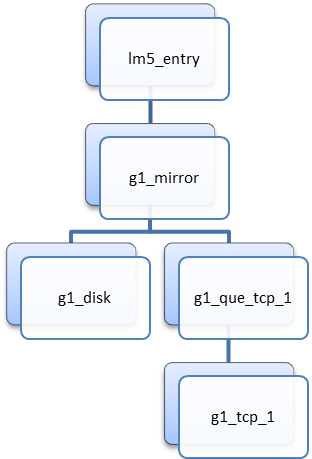
The following configuration will build the complete configuration illustrated above. This is very similar to the remote logging example with the addition of the g1_que_tcp_1 node which will queue failed log entries sent to the tcpclient node g1_tcp_1.
lm5_entry_remote rg1_entry
lm5_diskwriter rg1_disk
logger_logmod5_connect rg1_entry rg1_disk
lm5_entry g1_entry
lm5_mirror g1_mirror
logger_logmod5_connect g1_entry g1_mirror
lm5_diskwriter g1_disk
logger_logmod5_connect g1_mirror g1_disk
lm5_disk_queue g1_que_tcp_1
logger_logmod5_connect g1_mirror g1_que_tcp_1
lm5_tcpclient g1_tcp_1
logger_logmod5_connect g1_que_tcp_1 g1_tcp_1
g1_que_tcp_1->file_path /usr/local/netsweeper/logs
g1_que_tcp_1->file_prefix disk_queue_g1_que_tcp_1
g1_que_tcp_1->max_disk_size 10G
g1_que_tcp_1->max_disk_size_thresh 100K
g1_que_tcp_1->num_files 10
g1_tcp_1->remote_logger_port 3000
g1_tcp_1->remote_logger_host 192.168.1.123
The above configuration will make sure that even if the disk queue node fails, errors will be reported in the policy server error log indicating a critical problem has occurred.
Other Configurations
There are many possible configurations with the LogMod5 framework introduced in the 2.6.29.14 release. The above logging configurations will provide customers with the usable features available in the 2.6.29.14 release when combined with the other services like the WebAdmin interface and Reporter services. Moving forward with Reporter performance and Reporters the following configurations will become more apparent for some customers.
Reporting performance:
- Hashing of Log Files by User
- Hashing of Log Files by IP Address
- Log Filtering
Reporters and high availability:
- Failover configuration
- Logging to multiple remote servers
These configurations will be documented and once the reporter and other services can take advantage of these new features.
Log File Rotation
The settings below can be used for log file rotation. When they are changed, the log file format of logs will change. Old log files will not be rotated or written to. It is important when these settings are changed to manually remove old log files or manage log file rotation.
- log_peeraddress_enabled true
- log_identifier_enabled true
- logfile_type
Enabling Charting
To enable Charting, you have to modify the current LogMod5 configuration in the nsd.conf. These lines need to be added. You will need to also comment out or modify the existing LogMod5 configuration.
lm5_entry g1_entry
lm5_snmp_cats snmp
lm5_snmp_topdomains snmp1
lm5_snmp_groupcats snmp2
lm5_snmp_groupreqs snmp3
lm5_snmp_clientcats snmp4
lm5_snmp_clientreqs snmp5
lm5_snmp_grouptopdomains snmp6
lm5_diskwriter g1_disk
logger_logmod5_connect g1_entry snmp
logger_logmod5_connect snmp snmp1
logger_logmod5_connect snmp1 snmp2
logger_logmod5_connect snmp2 snmp3
logger_logmod5_connect snmp3 snmp4
logger_logmod5_connect snmp4 snmp5
logger_logmod5_connect snmp5 snmp6
logger_logmod5_connect snmp6 g1_disk
After clicking Submit to save the changes, Restart the Policy Server.
Logging to a Syslog Node
You can set up LogMod5 to use syslog for request logging by using the lm5_syslog. It is used as an exit node to send all log records to the syslog daemon.
# | logmod5 Syslog node |
# Declare as:
# lm5_syslog <NAME>
# This node sends all log records to the syslog daemon. Here are the configurable settings for the disk queue
# NAME->logger_fields field1 field2 field3 ...
# This allows to specify the log record fields that should be added to the logged record
# This setting overrides the global logger_fields setting for this node.
# For available field names see global logger_fields setting description.
# Default (if neither NAME->logger_fields nor global logger_fields is specified):
# NAME->logger_fields url ip user group denied category
# NAME->syslog_ident string
# This sets the syslog ident argument. It is the word that is prepended to every message in the syslog file.
# Default:
# none
# it means that syslog uses the program name "nsd" instead
# NAME->syslog_facility string
# This sets the syslog facility argument. It provides syslog the information about message source.
# It lets the syslog configuration file specify what file these messages should be written to.
# The facility can be: LOG_DAEMON, LOG_LOCAL0 - LOG_LOCAL7 or LOG_USER.
# Default:
# NAME->syslog_facility LOG_USER
# NAME->syslog_level string
# This sets the syslog level argument. This determines the importance of the message and extends the facility argument for more flexibility of destination file selection. The syslog node uses the same level (importance) for all request log messages.
# The level can be: LOG_ALERT, LOG_CRIT, LOG_ERR, LOG_WARNING, LOG_NOTICE, LOG_INFO or LOG_DEBUG.
# Default:
# NAME->syslog_facility LOG_INFO
See also: LogMod5 Node Definitions
Logger Thread CPU Settings
The following settings can be set for the logging thread
logger_affinity [ ALL | cpuno ] [ cpuno ] ...
- Sets which CPU this thread can run on. Starts at index of 1 and goes up to the number of CPU's on the system. ALL for any CPU to be used.
logger_priority
- The priority of this thread, -19 highest and 20 lowest 0 is the default.
- logger_scheduler [ SCHED_RR | SCHED_FIFO | SCHED_BATCH | SCHED_OTHER ]
- Change the Scheduler used for the logger thread.
See above for more information.
Logger Thread Queue Check Interval
This is the amount of time in milliseconds we wait before we check the queue. If the soft limit is hit, the logger thread will be forced to check the queue. This should be left at 100 msecs or possibly be lowered on extremely high performance 16 core plus machines.
Default: logger_queue_check_interval_msec 100 msecs
Format: logger_queue_check_interval_msec milliseconds
Logger Identifier
This is the identifier for policy server generated log entries. When sending # to a remote system or locally logging to extended binary log files, we can store this logger identifier.
Default: logger_identifier $HOSTNAME
Format: logger_identifier string
Request Log Entry Fail Mode
If a log entry fails to be processed, we can optionally serve a deny page and deny the request. If local logging is configured and the log entry cannot be written to disk, this failure mode will be enforced. If remote logging is configured with out of band logging, the log entry must fail to send to the remote server and fail to be added to the out of band log file before the log entry fails.
Default: logger_failure denypage
Format: logger_failure {denypage|shutdown}
Logger Queue Soft Limit
This is the soft limit of the logger queue. When adding log entries to the queue we signal the logger processing thread once this soft limit is reached. This allows us to process log entries in batches to increase performance.
Default: logger_queue_soft_limit 4000
Format: logger_queue_soft_limit log entry count
Logger Queue Hard Limit
This is the hard limit of the logger queue. If we reach this limit we start to delay policy server processing.
Default: logger_queue_hard_limit 10000
Format: logger_queue_hard_limit log entry count
Logger Queue Hard Limit Discard Log Entry
When the hard limit is hit, but default the policy service will slow down and wait for the queue to be processed. However, on high performance systems you may wish to discard log entries. When discarding log entries you can either serve a deny page or shutdown the policy service.
Default: logger_queue_hard_limit_discard false
Format: logger_queue_hard_limit_discard [true|false]
LogMod 5 Terminology
The following terminology is used in most LogMod5 documentation:
|
Term |
Description |
|---|---|
|
Graph OR graph instance |
A collection of nodes and node connections, forming a complete “tree”, makes a ‘graph instance’. It is possible to have multiple ‘graph instances’ running at the same time in the nsd. |
|
Node OR node type |
A contained ‘package’ of behaviour that can be placed in a graph. Nodes are ‘instantiated’ into a graph. Example ‘node types’ include: lm5_entry, lm5_failover, tcpclient, and many others (listed below). |
|
Instance OR node instance |
When a node is inserted into a graph becomes a ‘node instance’ in the graph. Nodes can be instantiated multiple times in the same graph. For example, the tcpclient node is instantiated multiple times in the example above, allowing packets to failover from one tcpclient node instance (configured to connect to some remote server) to another tcpclient instance (usually configured to connect to some completely different remote server). |
|
Connection |
The route followed by packets traveling between two nodes is usually called a ‘connection’. Connections are always unidirectional, and should be thought of as flowing ‘downwards’. |
|
Channel |
Nodes will refer to their incoming connection(s), connections upwards, as ‘upstream channels’ and will refer to their outgoing connection(s) as ‘downstream channels’. Channels are sometimes referred to by their number and, in those cases, numbering begins at #0, for example, a node with two downstream connections will have a ‘downstream channel #0’ and a ‘downstream channel #1’. |
|
Packet |
Information sent through a graph is always sent in a unit called a ‘packet’. In LogMod5 logging, packets are always bundles of one or more request log entries. In future releases, packets may contain other kinds of information as well |
|
Signal |
When working with the internals of LogMod5 nodes, you may hear about ‘signals’. A ‘signal’ is sent by nodes to their immediate upstream and downstream neighbours to convey some simple information about that node’s status. Signals are not described in this document, but the defined list of signals currently is the following four: START signal, STOP signal, DATA signal, and DONE signal. |
|
Partial processing |
Since some packets (most packets) will contain multiple log entries, it is possible for a packet to be ‘partially processed’. This means that some of a packet’s entries have been successfully processed (sent to a remote server, for example) and some were not (because there was an error after the first few entries were sent). Partial processing allows other nodes to takeover processing of a packet’s log entries by only handling the entries that have not been taken care of already. This system ensures that all entries get processed once, with no duplication of entries and no loss of entries. |
See also: LogMod5 Node Definitions