Monitoring
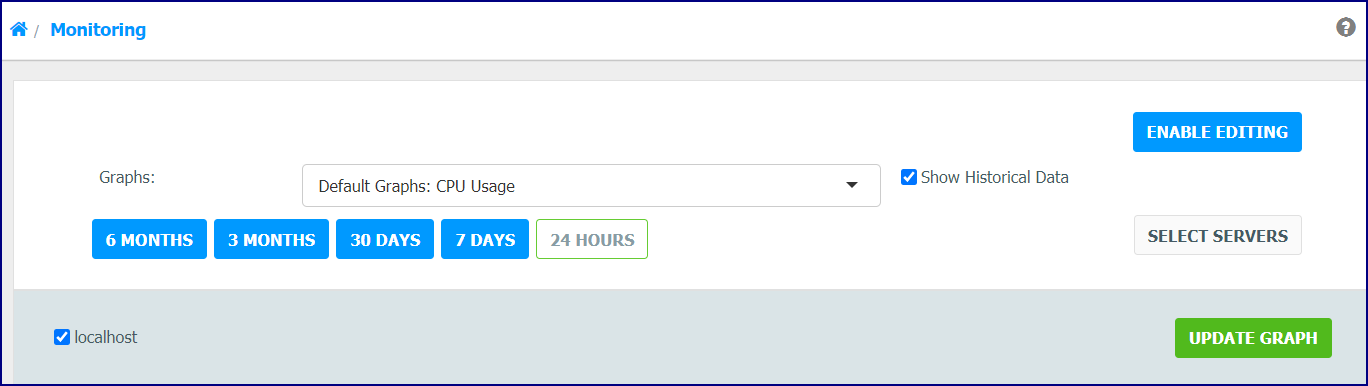
Monitoring in the WebAdmin use real-time graphs. You can use the default graph available in earlier releases or create graphs featuring custom data to view in real-time or in timeframes of 6 months, 3 months, 30 days, 7 days, or 24 hours. You can customize which servers are to be monitored at any time to reduce clutter and allow them to efficiently find exactly the data they are looking for. Any graphs created or modified in Monitoring Graphs can also be viewed on the Home Page.
Functionality includes:
- Create and modify custom graphs and set a default graph
- The CPU Usage graph will load by default until the user changes the default graph setting
- Display Monitoring Graphs on the Home Page
- Display historical or real-time data for the selected graph, and save these settings
- Zoom in on graph selection
- All available MIBs appear in the select boxes on page load
- The user can select which servers they would like to view in any graph.
- For users upgrading to Netsweeper 5, any custom graphsets will be retained in the new system. The titles of all graphs in a custom graphset will be prepended with the graphset name. For example, CPU Usage in the Default graphset appears in the dropdown as “Default Graphs: CPU Usage”
- Graphs can be used in place of running nsrate, mpstat and top commands
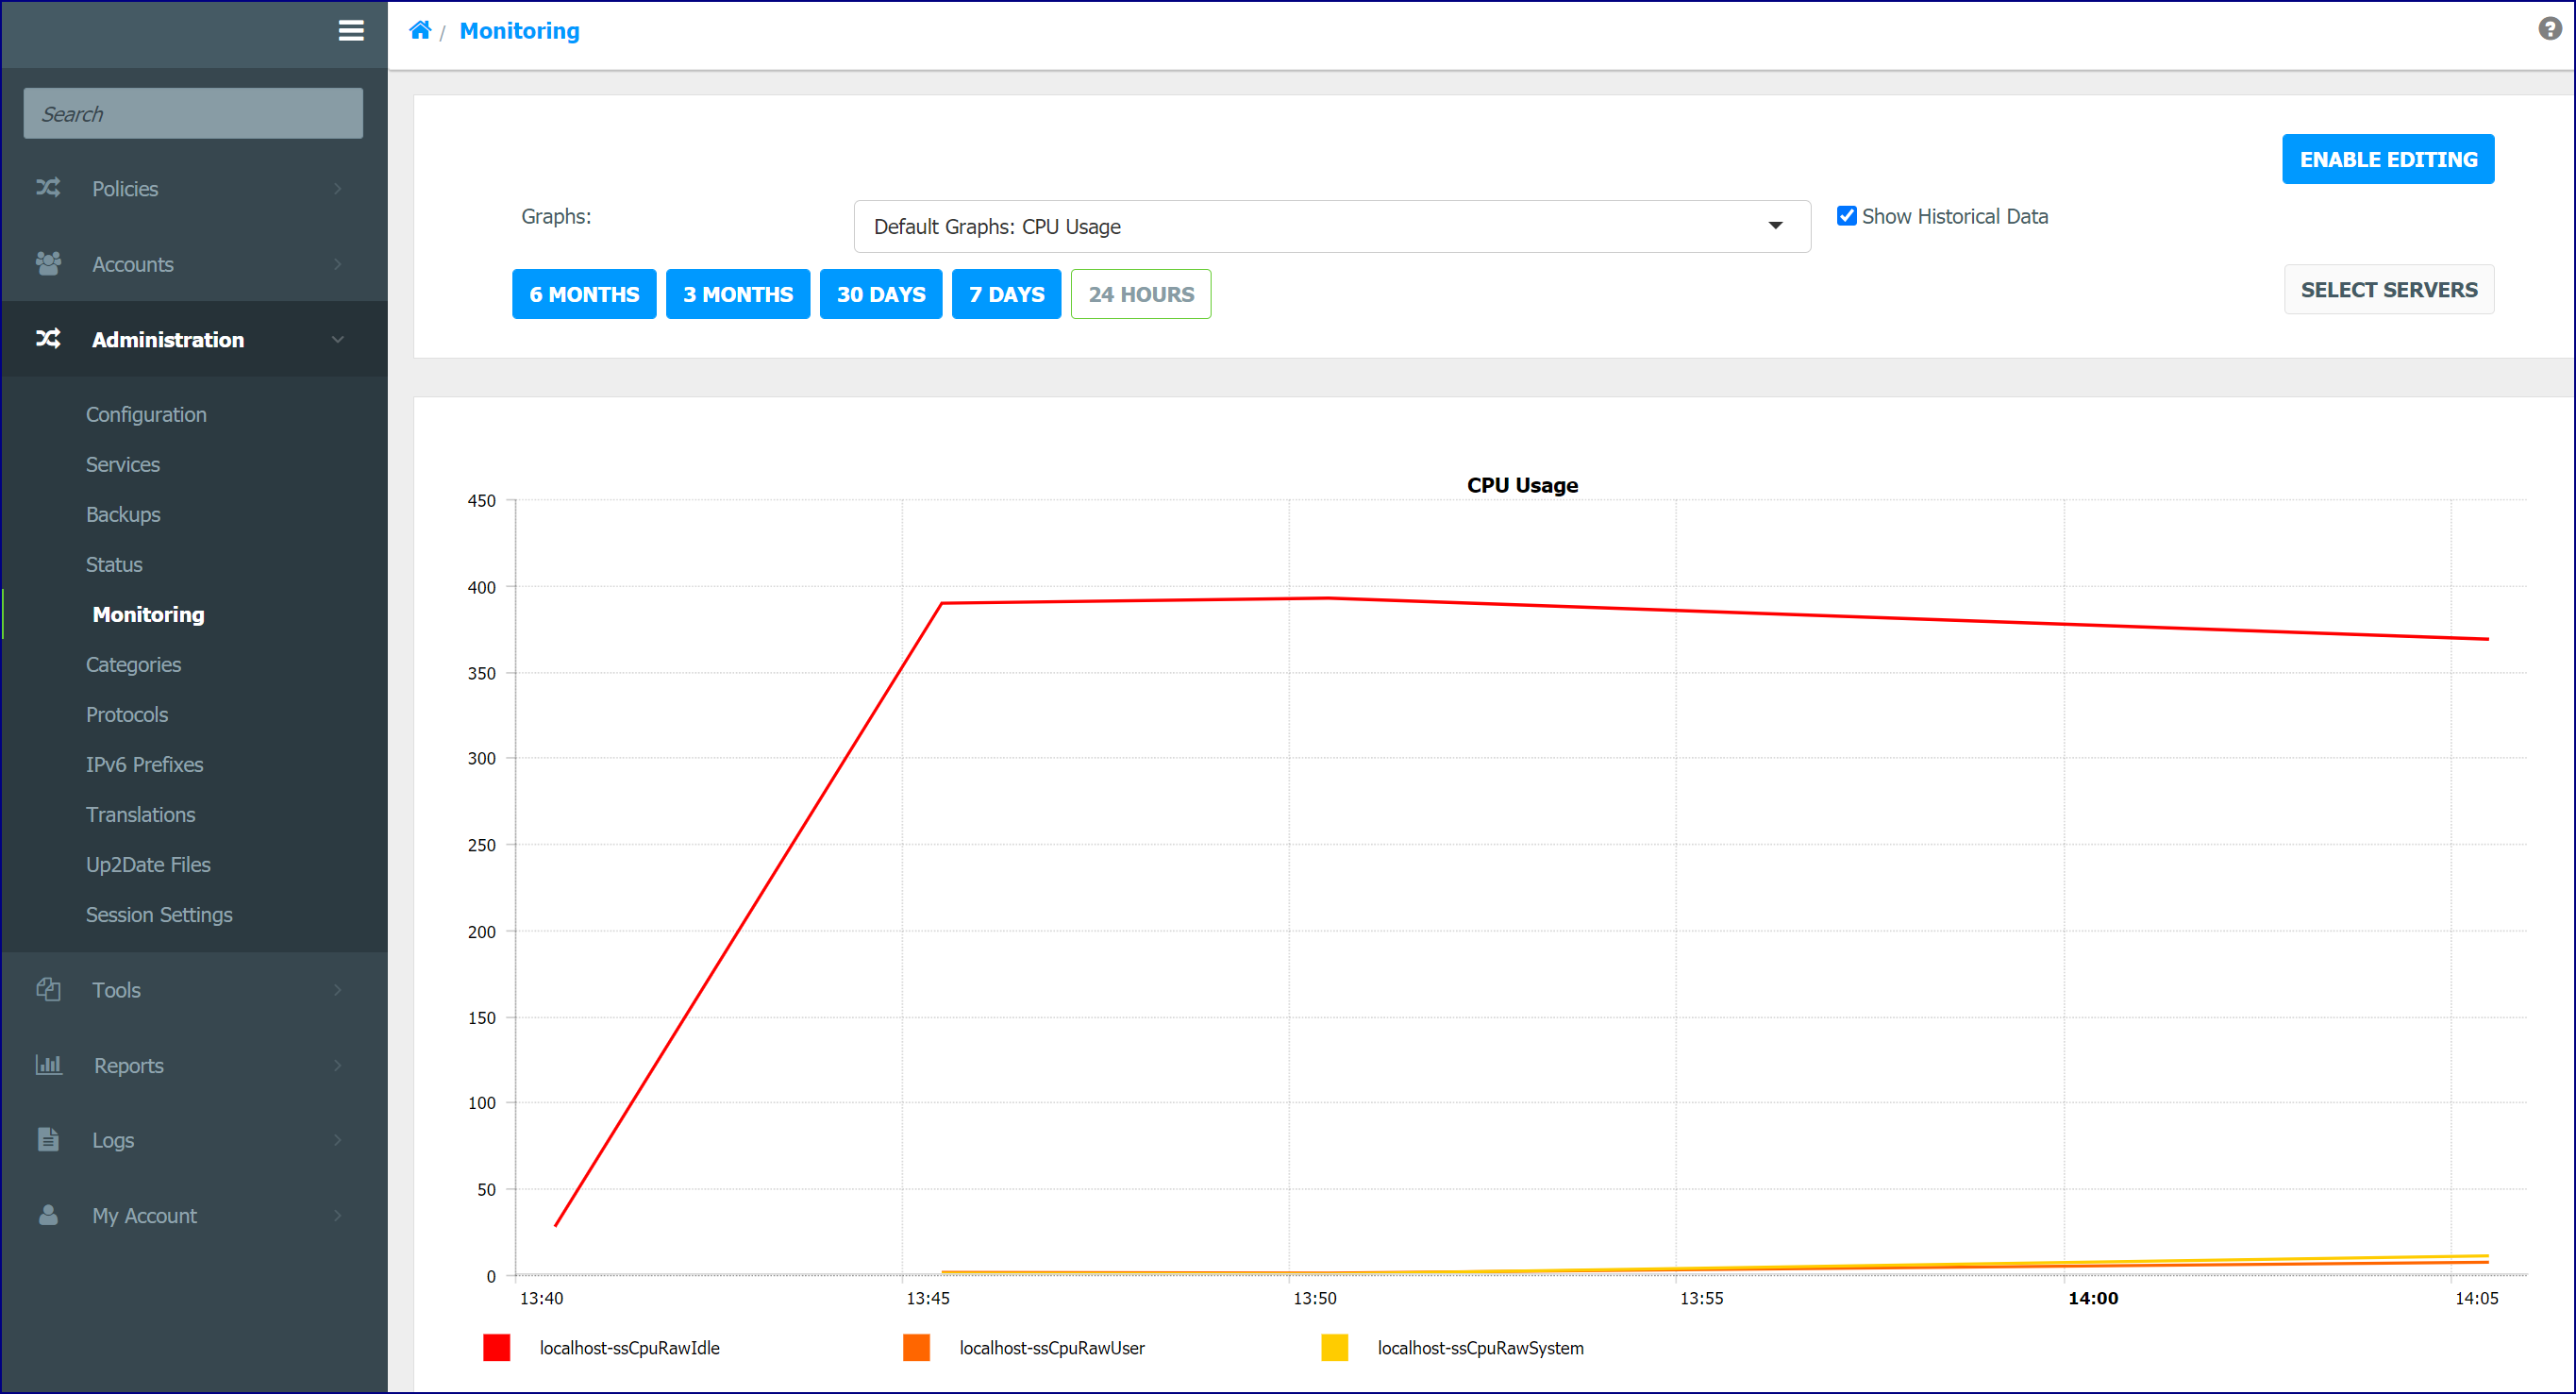
Creating and Edit Monitoring
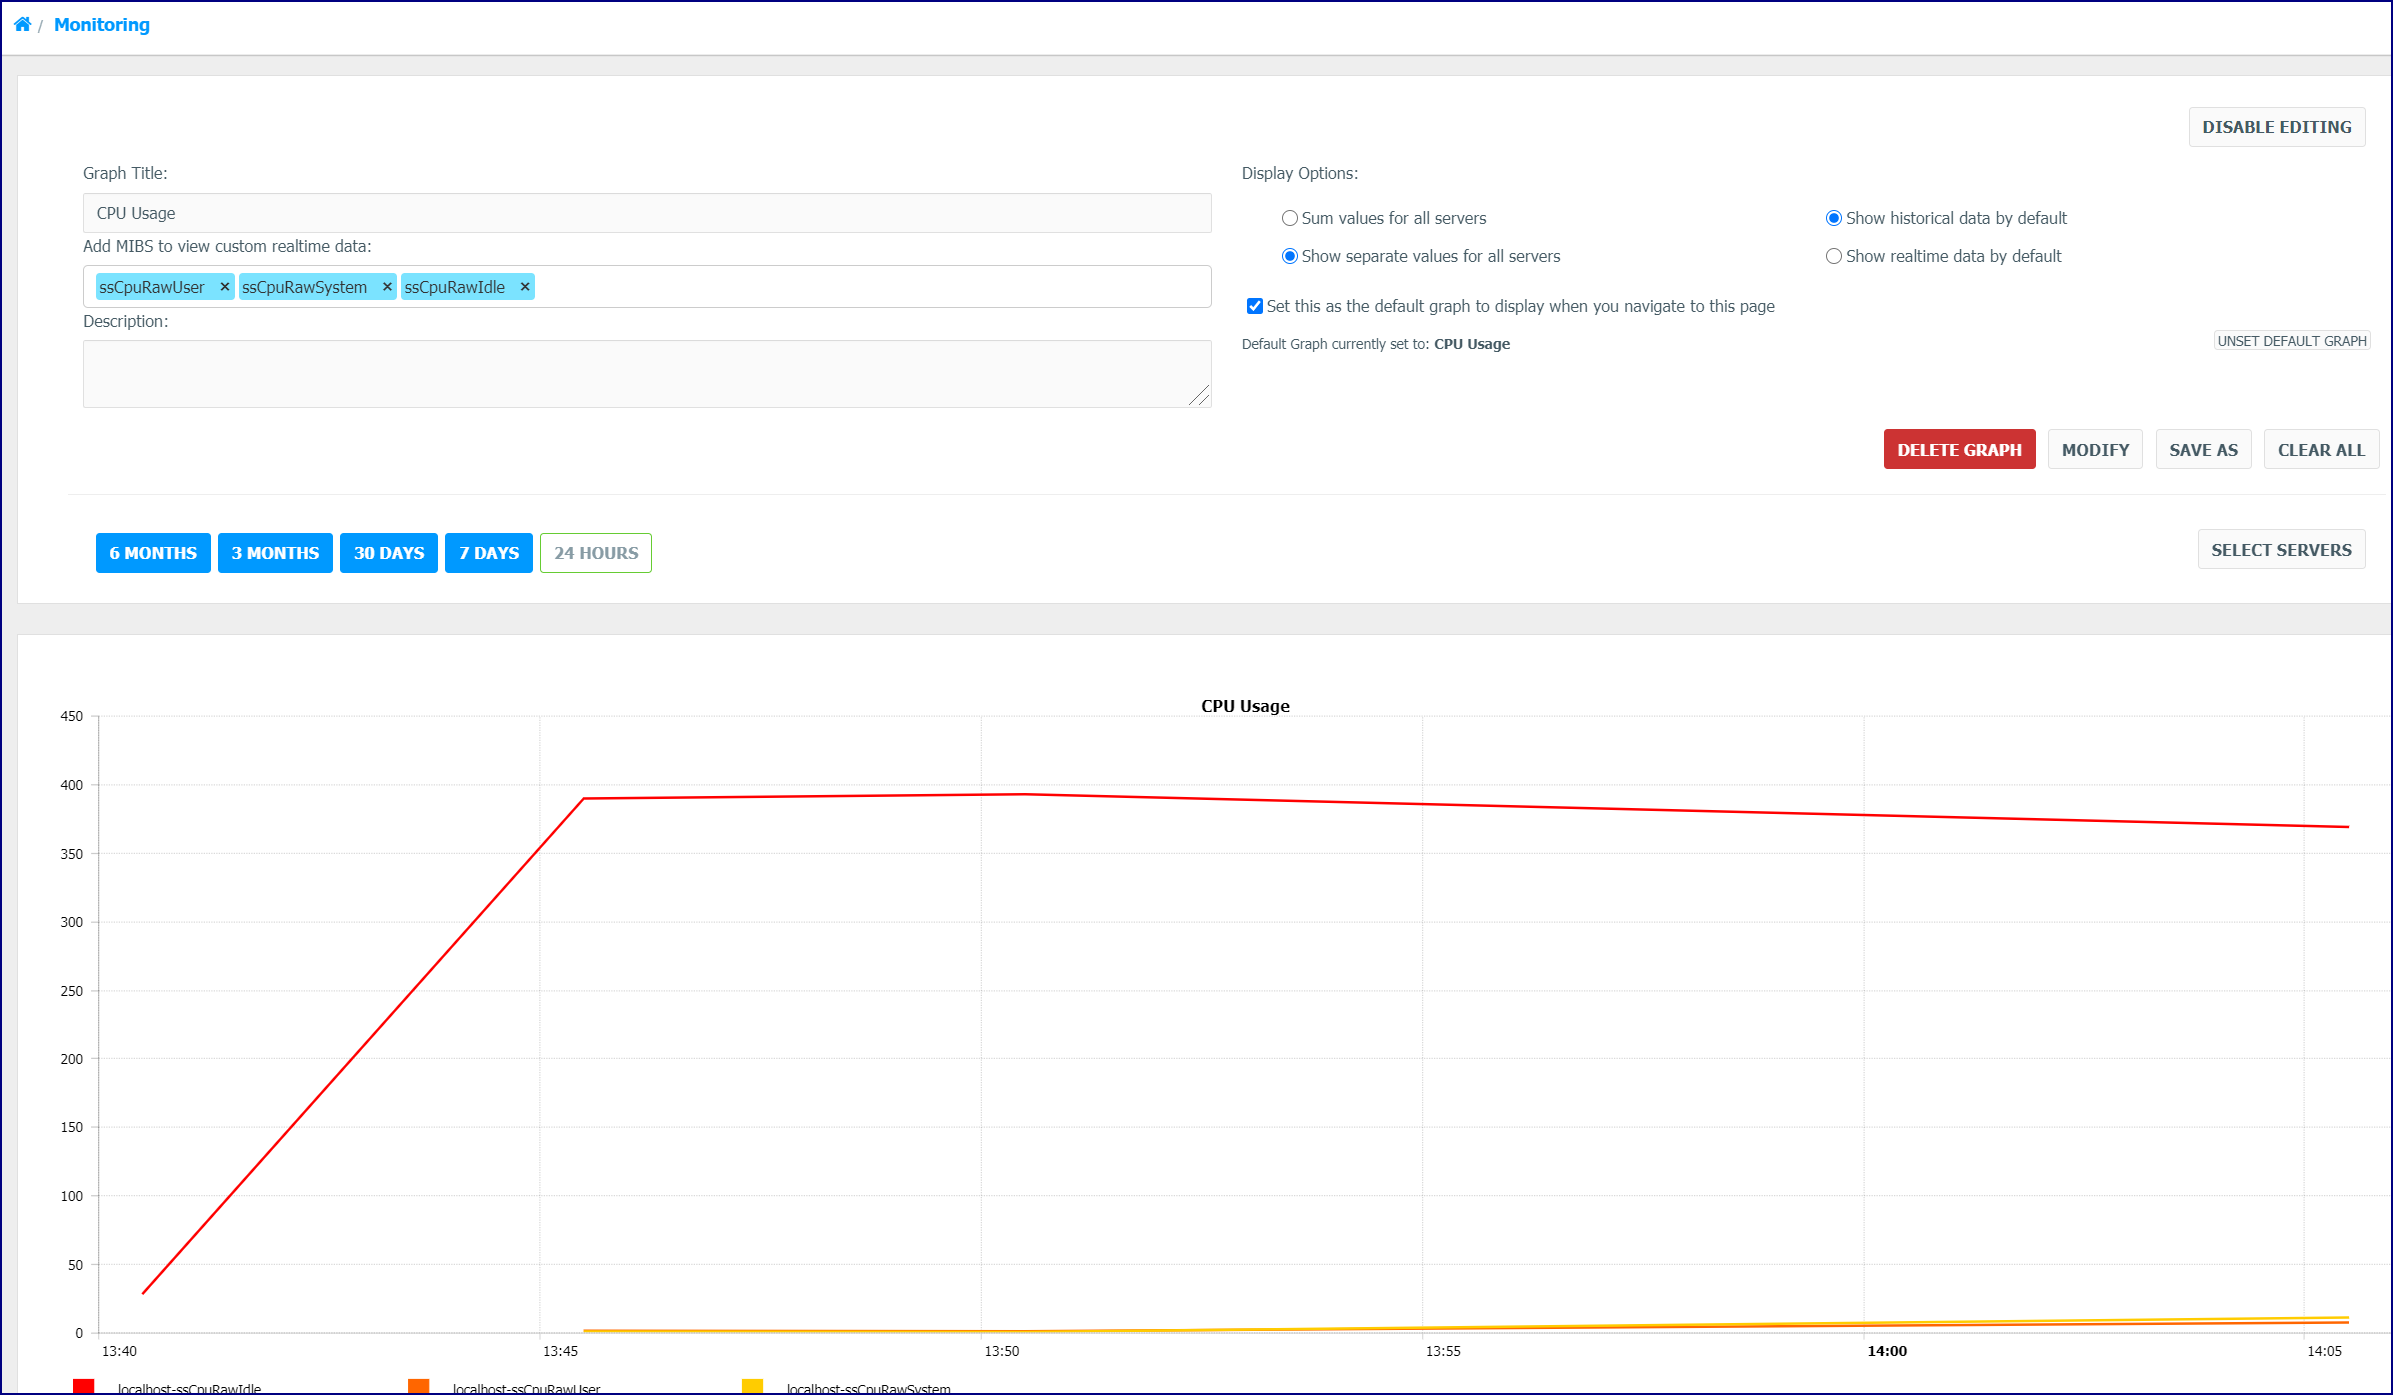
Click the Enable Editing button to display the Edit information. In this window, you edit or create a graph.
- Use the Delete Graph button to delete the selected graph.
- The Modify button saves modifications made to an existing custom graph.
- When modifying an existing custom graph, you have the option of saving changes with the Modify button or changing the title and saving as a new graph with the Save As button.
- When creating a new graph, use the Add button to save the graph after adding a title and ‘MIBs’. A Save As button displays when you have loaded an existing custom graph.
- Use the Clear All button if you wish to clear the data and create a new graph.
Add MIBS to view custom real-time data:
You can add or modify MIBs in your custom graphs. Click the field to open the dropdown list of MIBs. You can also type the name of the MIB you are searching for to use the autocomplete feature. Autocomplete searches MIB names and descriptions for the text entered by the user.
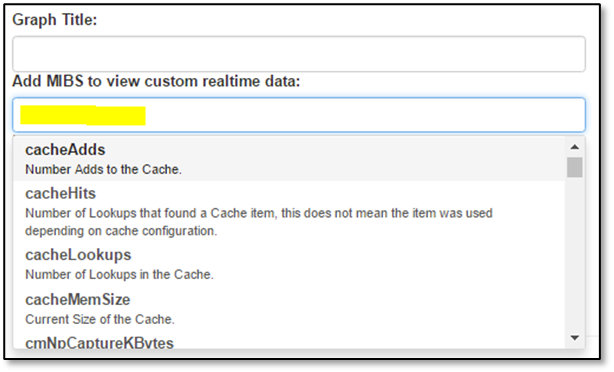
Search and add the MIBs you require.
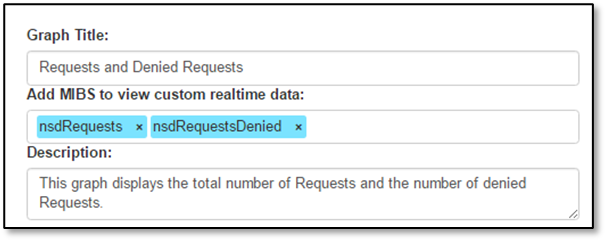
Display Options:
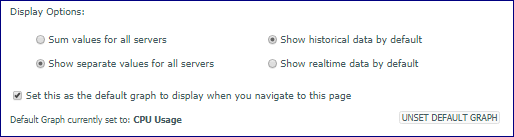
Use the ‘Display Options’ section to show the type of data you want in the graph. You can save graphs with these settings or change the current view.
|
Option |
Description |
|---|---|
|
Sum values for all servers |
The sum of data from all servers in the Cluster. This will sum data from each server for each MIB. A graph line will appear for each selected MIB. |
|
Show separate values for all servers |
This displays separate graph lines for each server/MIB combination. |
|
Show historical data by default |
Historical data is displayed by default when the graph is selected. |
|
Show real-time data by default |
Real-time data is displayed by default when the graph is selected. |
|
Set this as the default graph to display when you navigate to this page |
Click this option to have the selected graph display as the default graph when you navigate to the page. |
|
Unset Default Graph |
Remove the default graph option. A default graph will no longer load automatically when you navigate to the page. |
Display Specific Servers
Click the Select Servers button to display available servers. All servers are selected by default. The user may choose the servers which they would like to view data for, and select only those servers; the graph will refresh to show the specified data. This allows the user to customize their view and improve processing time by cutting out data they do not need.
The Update Graph button manually updates the graphs for the selected servers.
Zoom and Reset Zoom
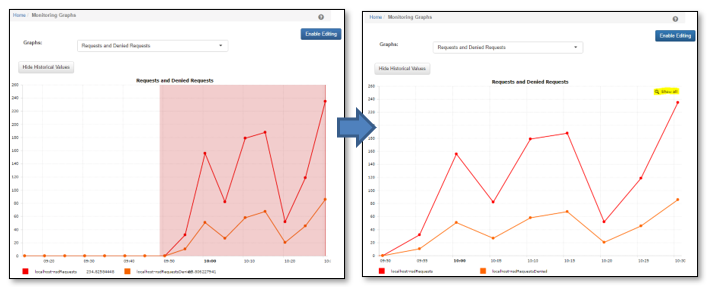
You can drag the mouse over a section of the graph to zoom in on the selection. The graph displays like this. Click the Show all button to zoom out.
Monitoring MIBs
The server MIBs need to be enabled for the Monitoring Graphs to work.