WebAdmin General Functionality
This document gives a brief overview of the general functionality of the WebAdmin.
 Filtering Table Entries - Advanced Filter
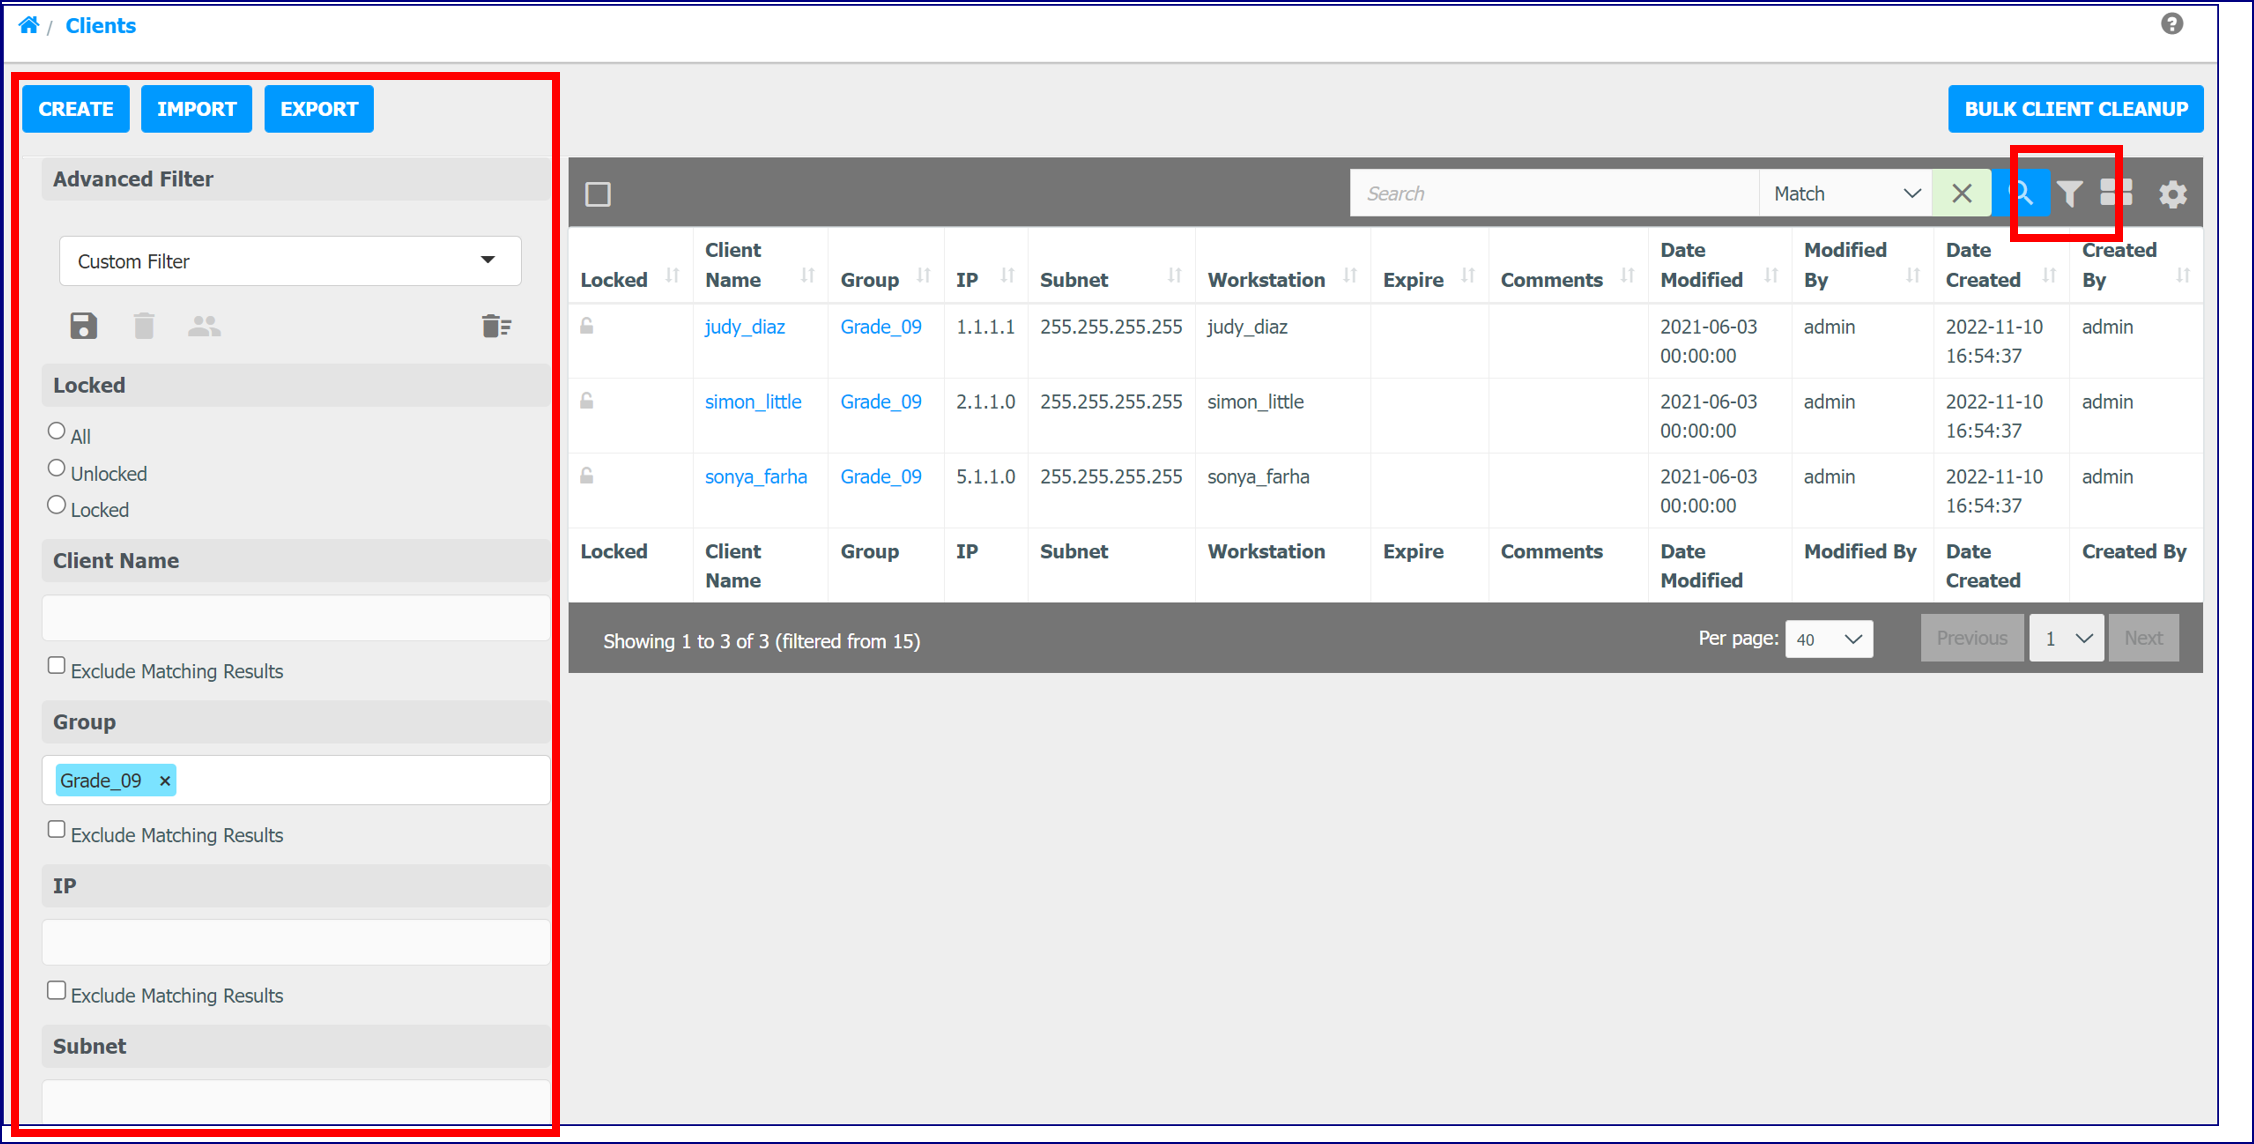
Select the Advanced Filter icon at the top of all tables to open the Advanced Filter pane on the left side. If the Advanced Filter icon is green, it indicates that a Filter is already active.
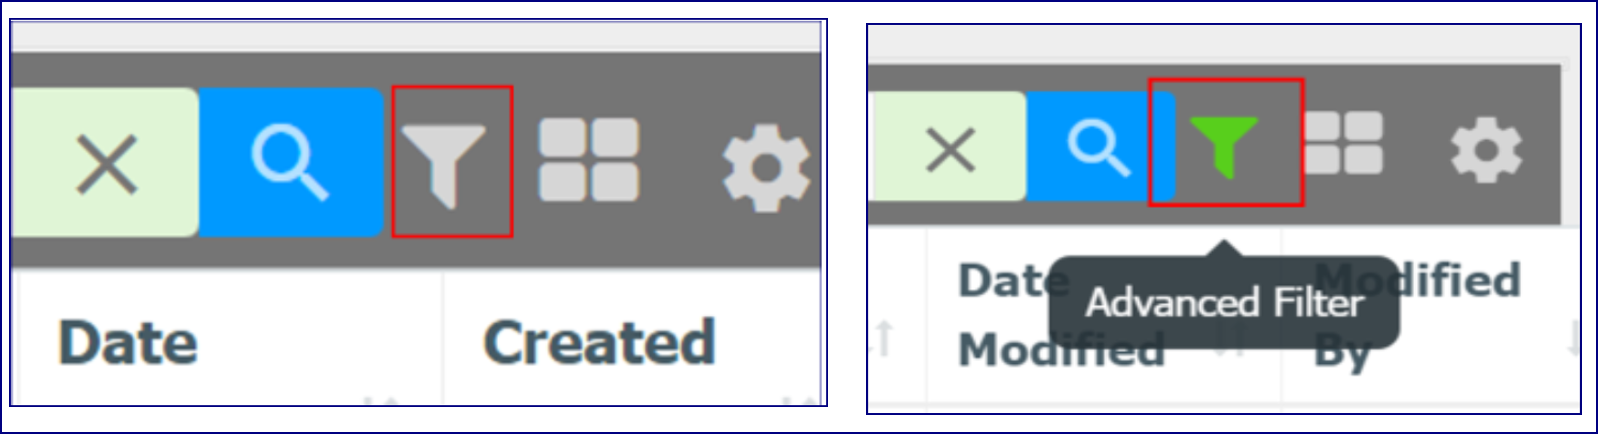
Choose the item(s) you wish to filter by and select the magnifying glass icon. The Filtered data displays.
Name, Save, Load and Delete Filters
The section at the top of the Filter Pane can be used to name and save a filter or load previously saved filters. Enter the name of the Filter and select the Save icon to save your filter. Select a filter in the dropdown to load it. There is a delete all button on the right if you want to clear all your filters.
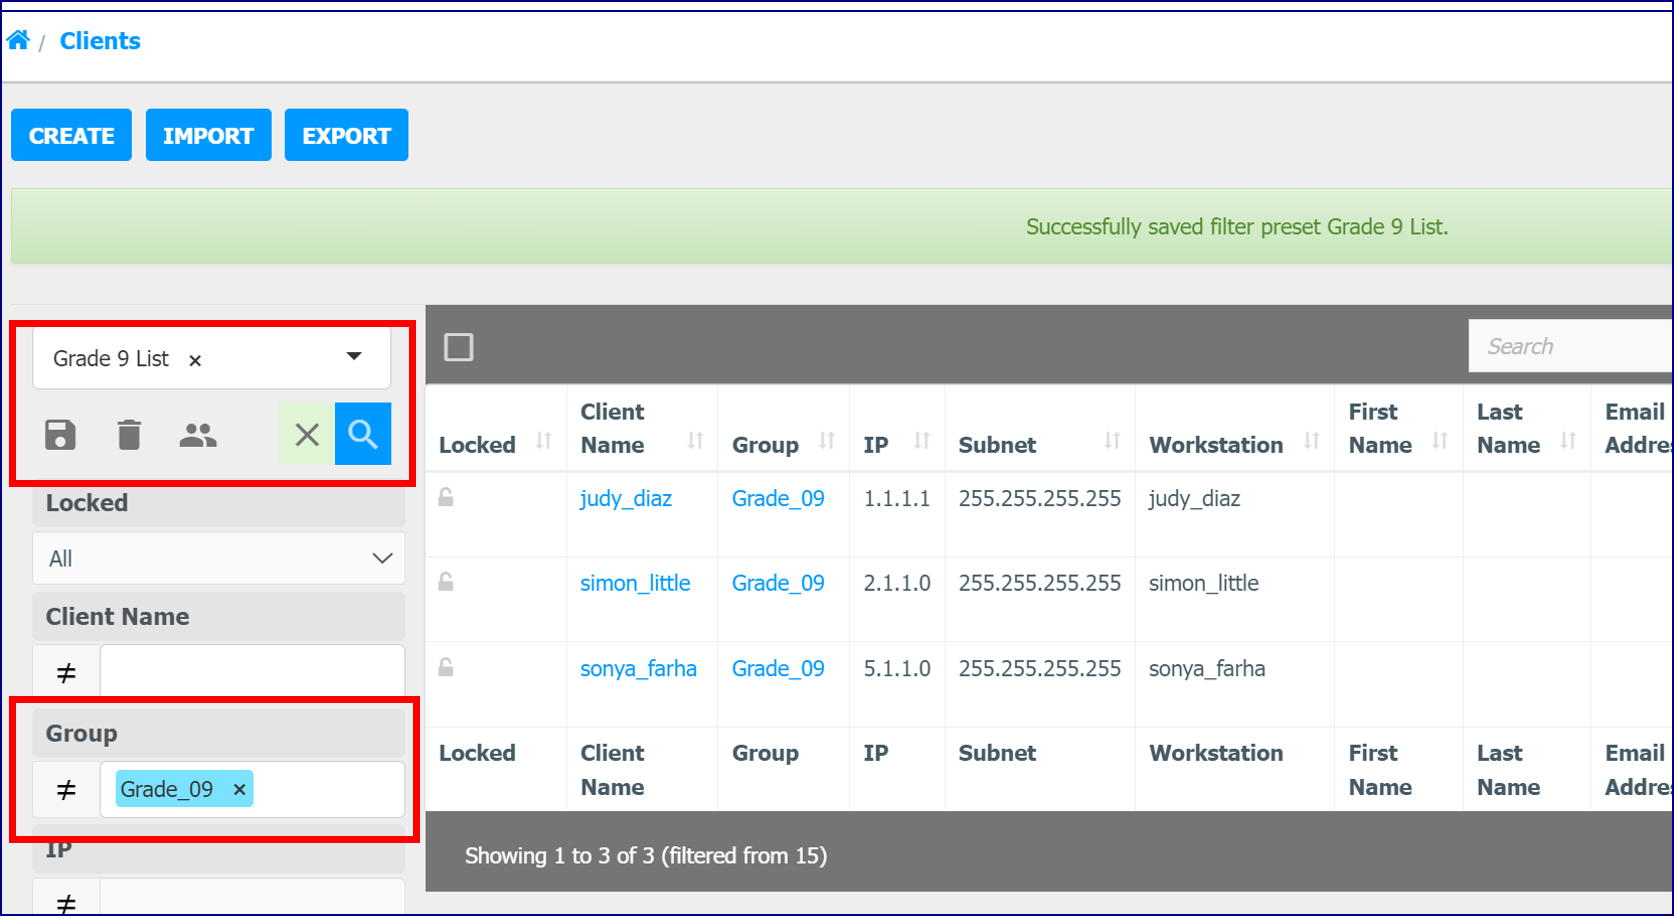
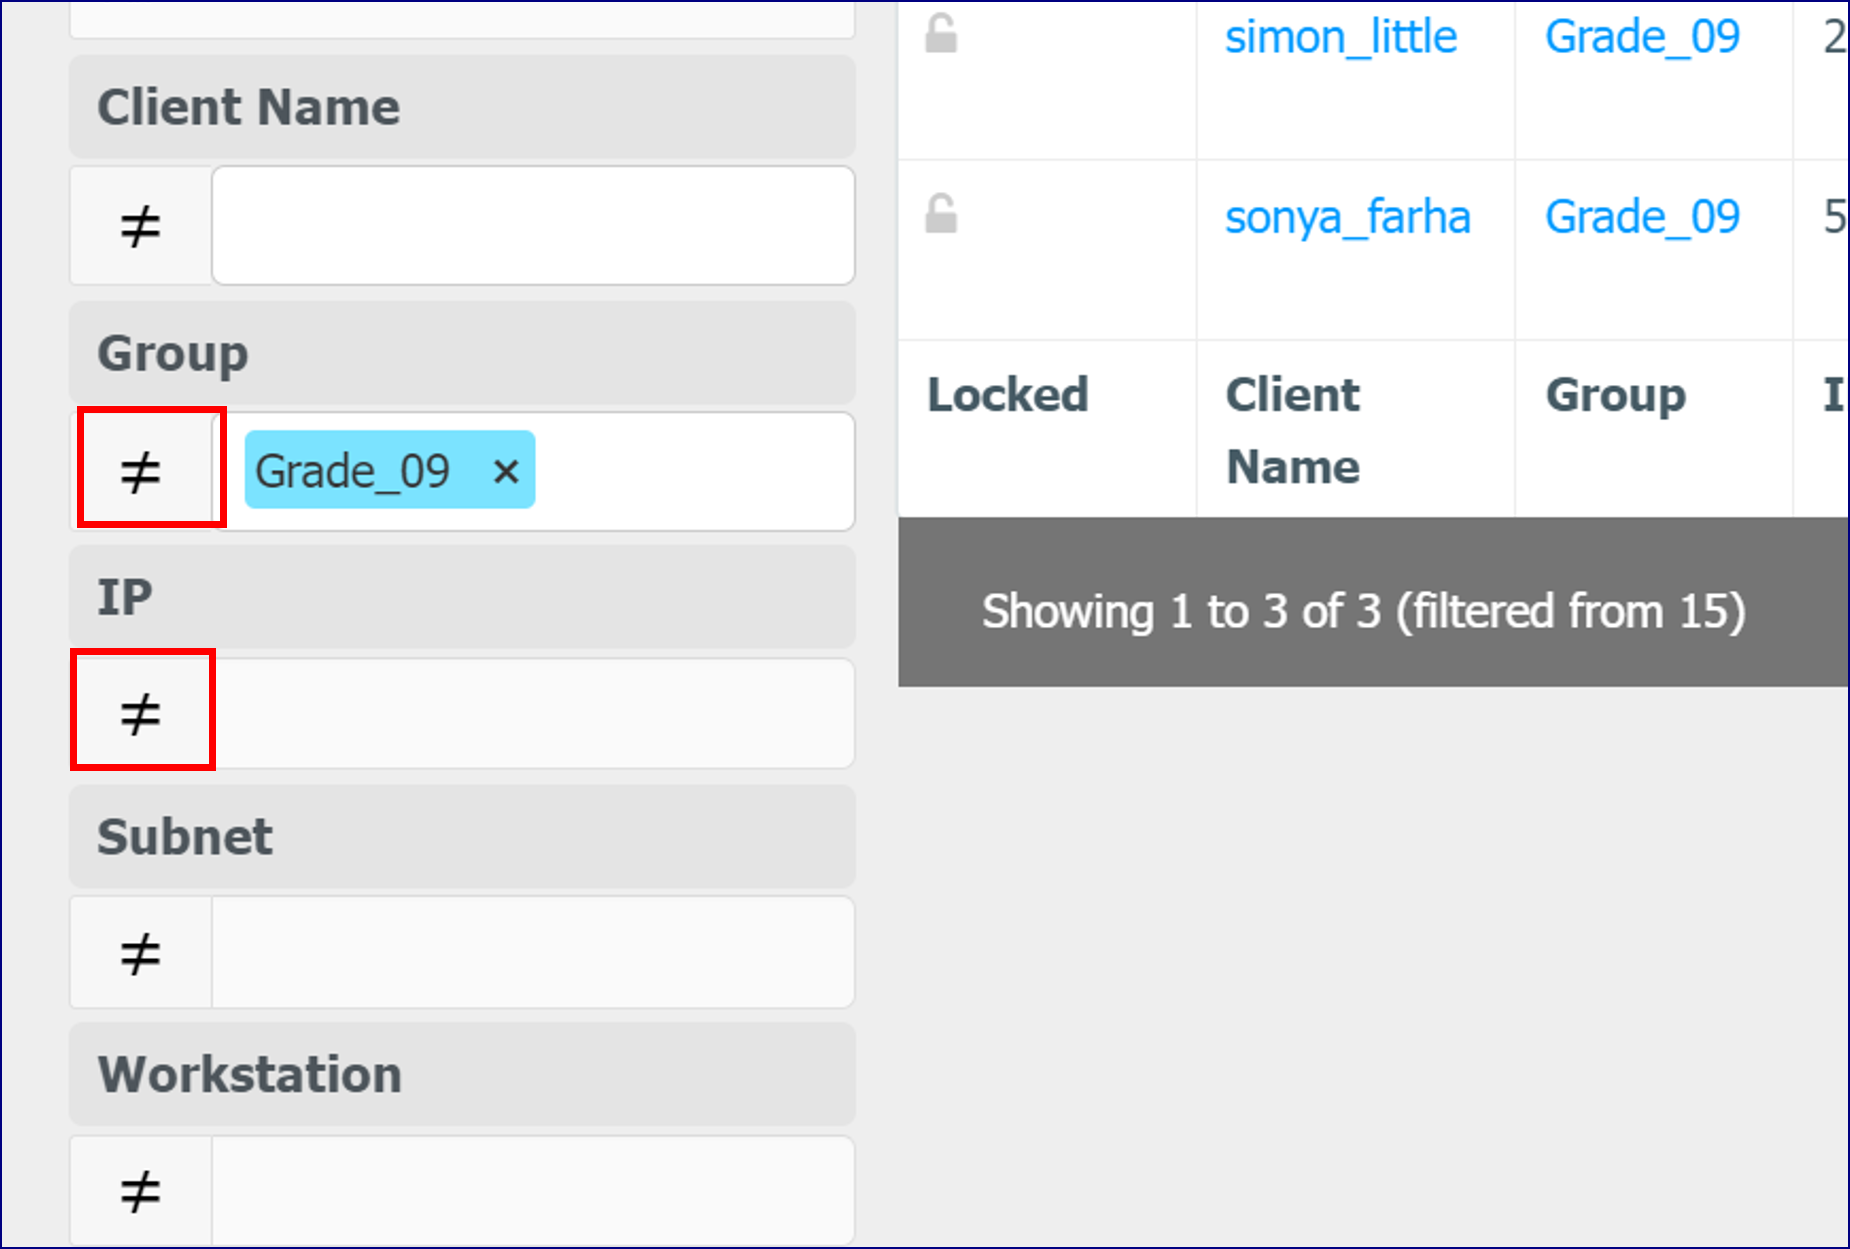
'Exclude Matching Entries' applies a 'NOT' operator to your List entry filter.
Tile/Table View
for WebAdmin Tables
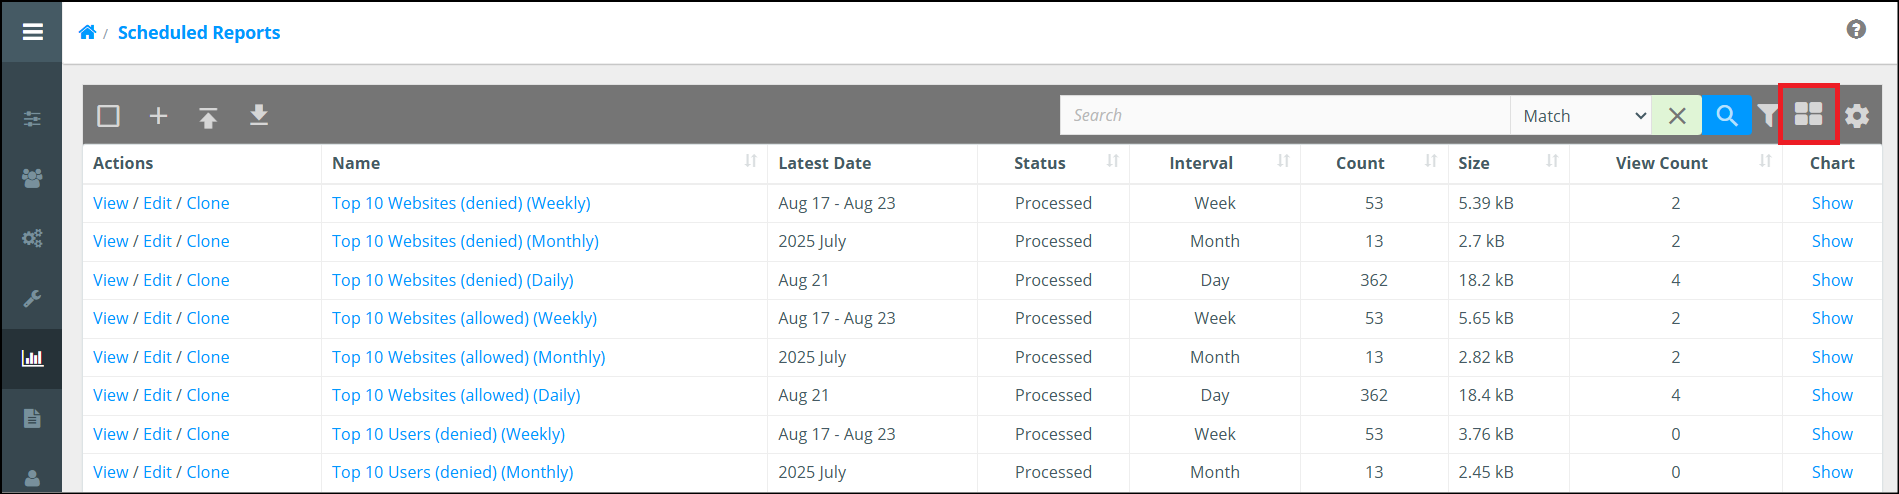
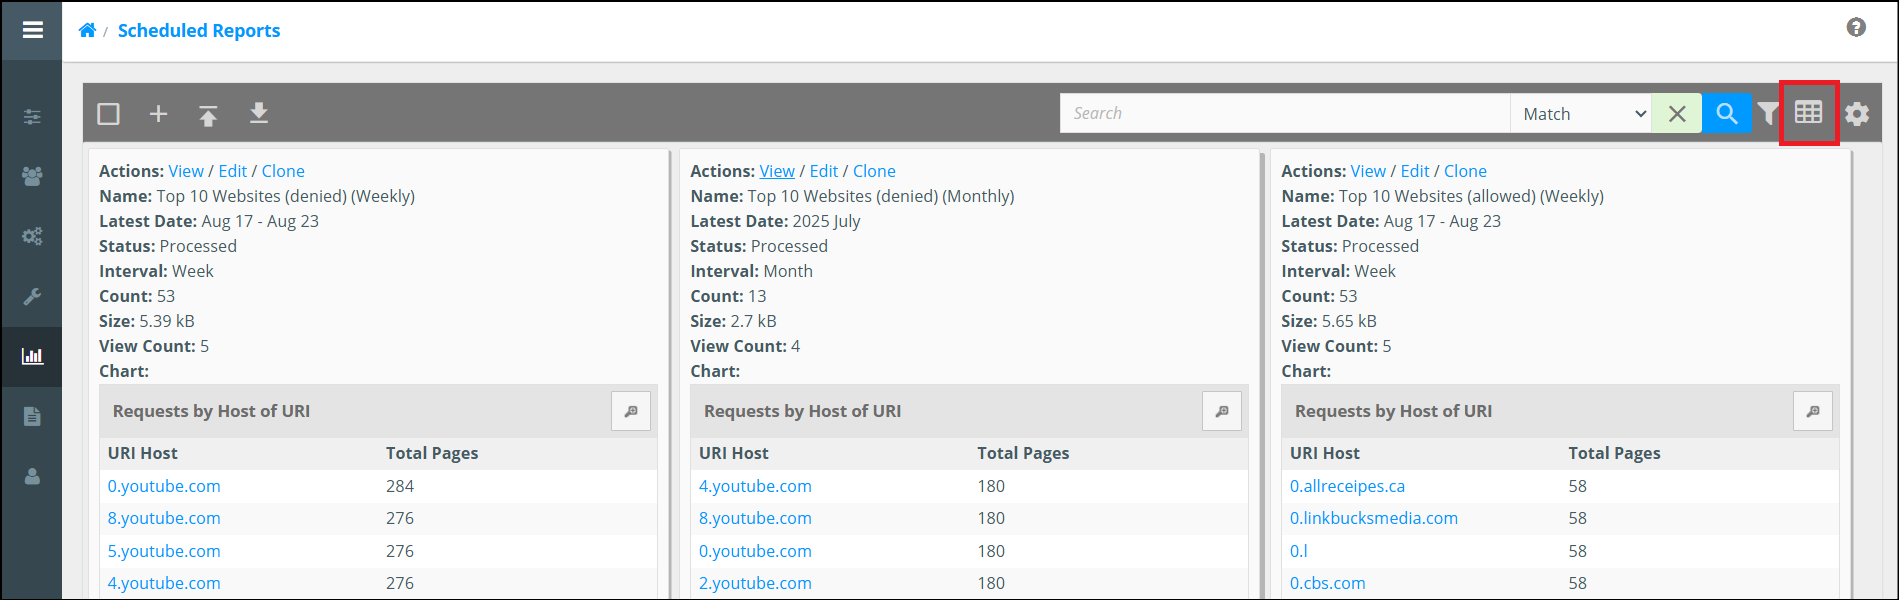
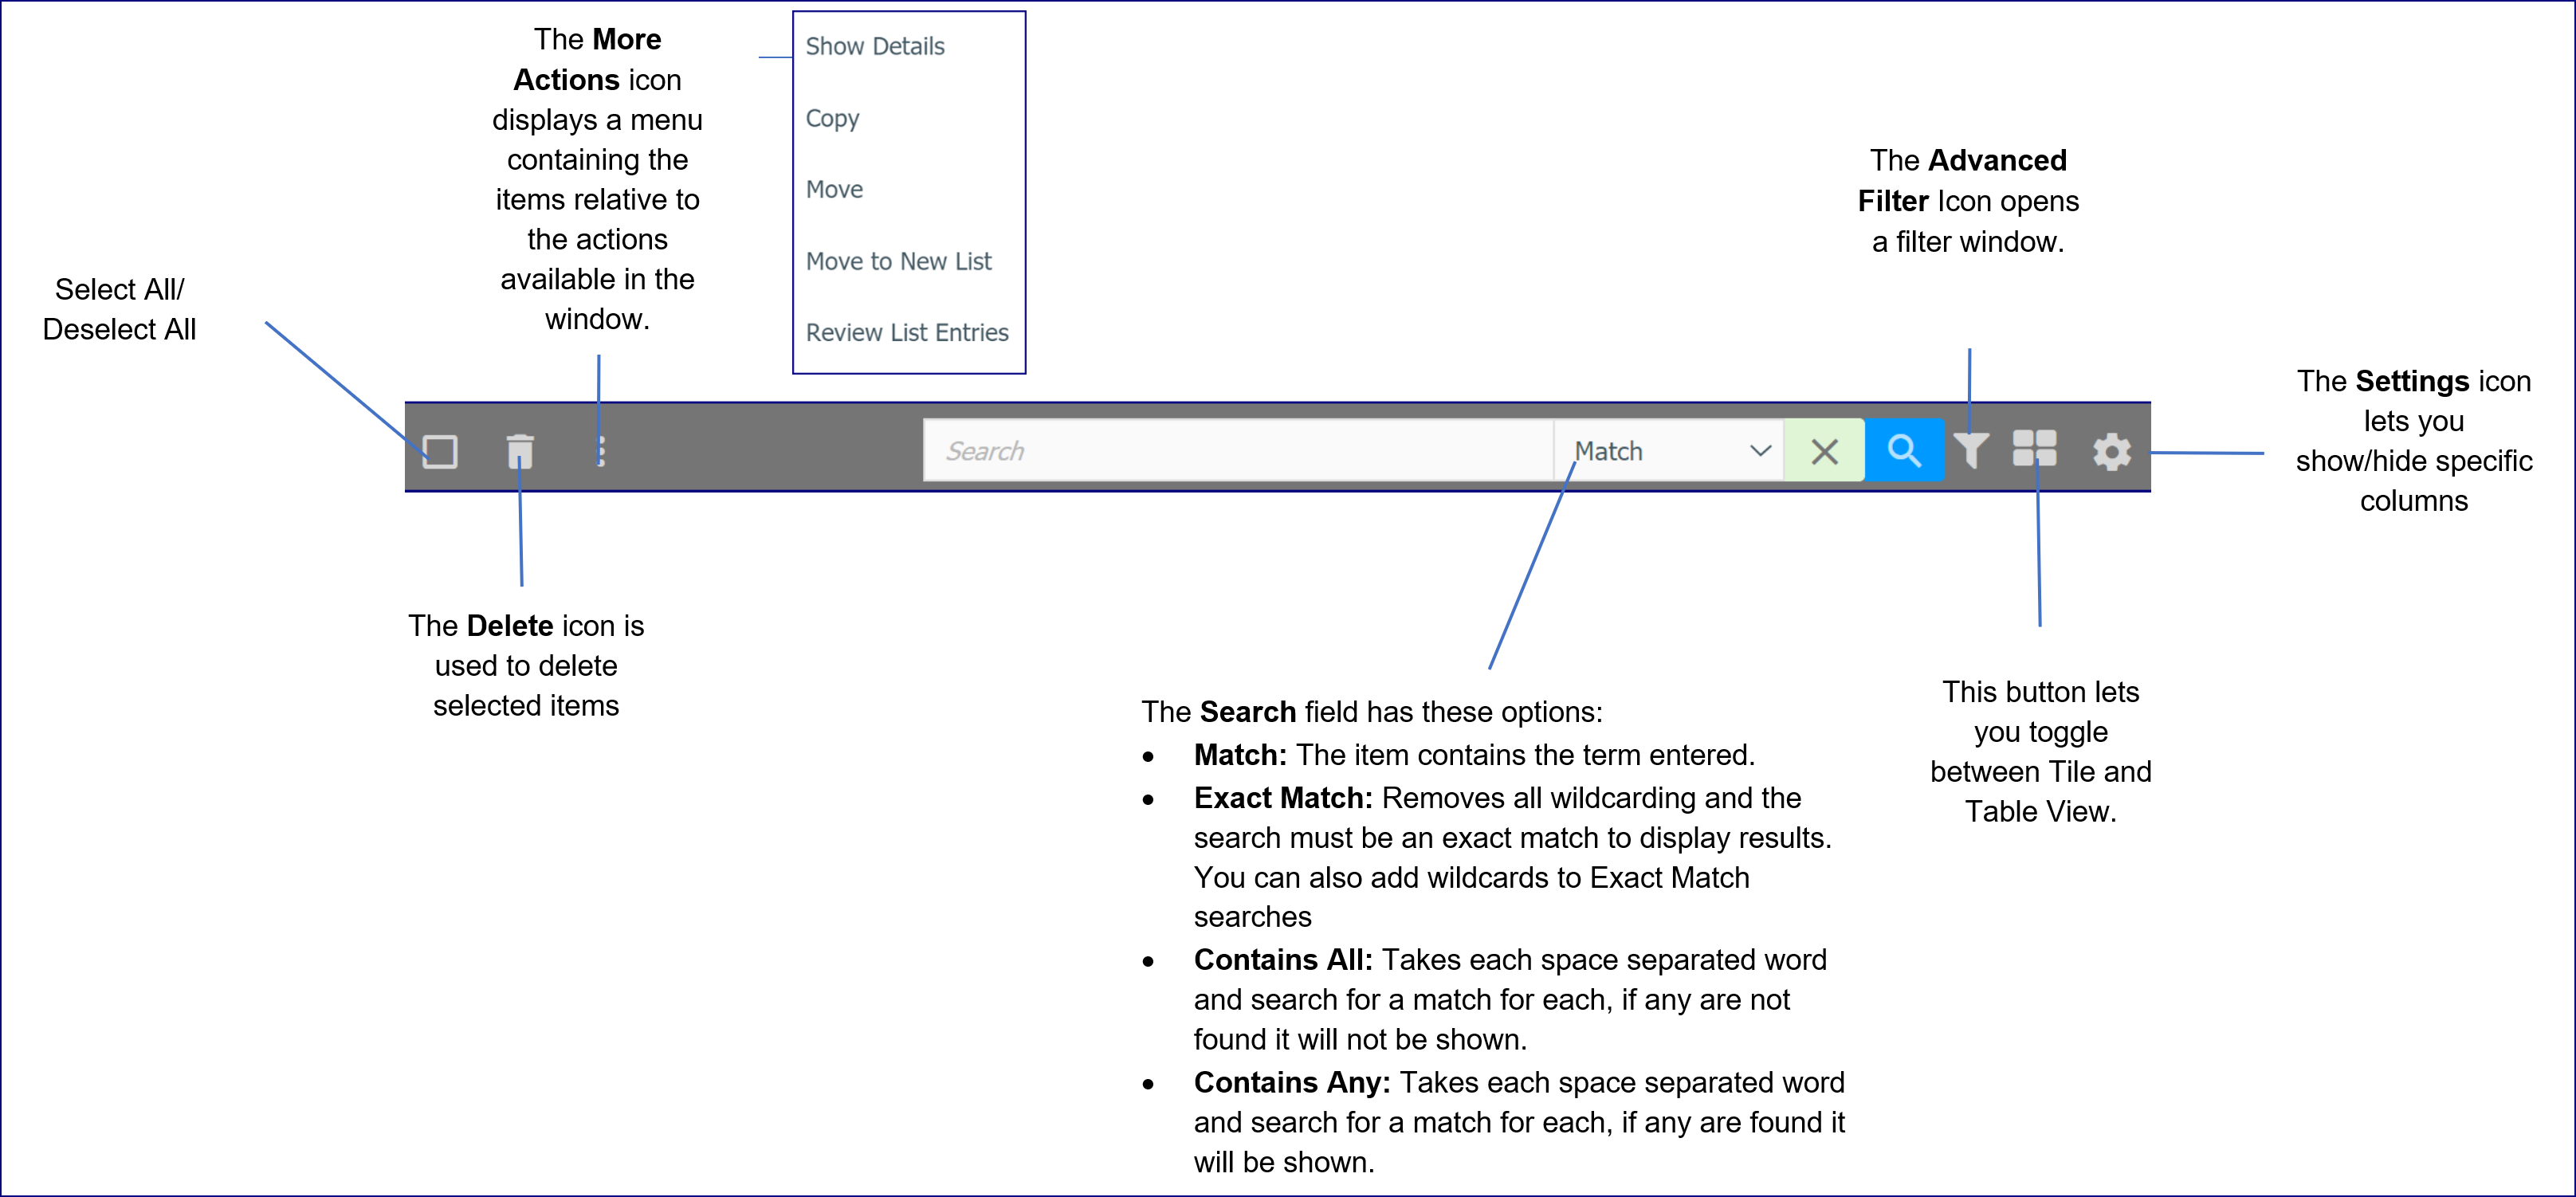
All WebAdmin tables can be toggled between a Tile and Table view. In addition, you can also drag and drop to reorder columns when in Table view. This allows you to customize the view of each page to better suit your requirements.
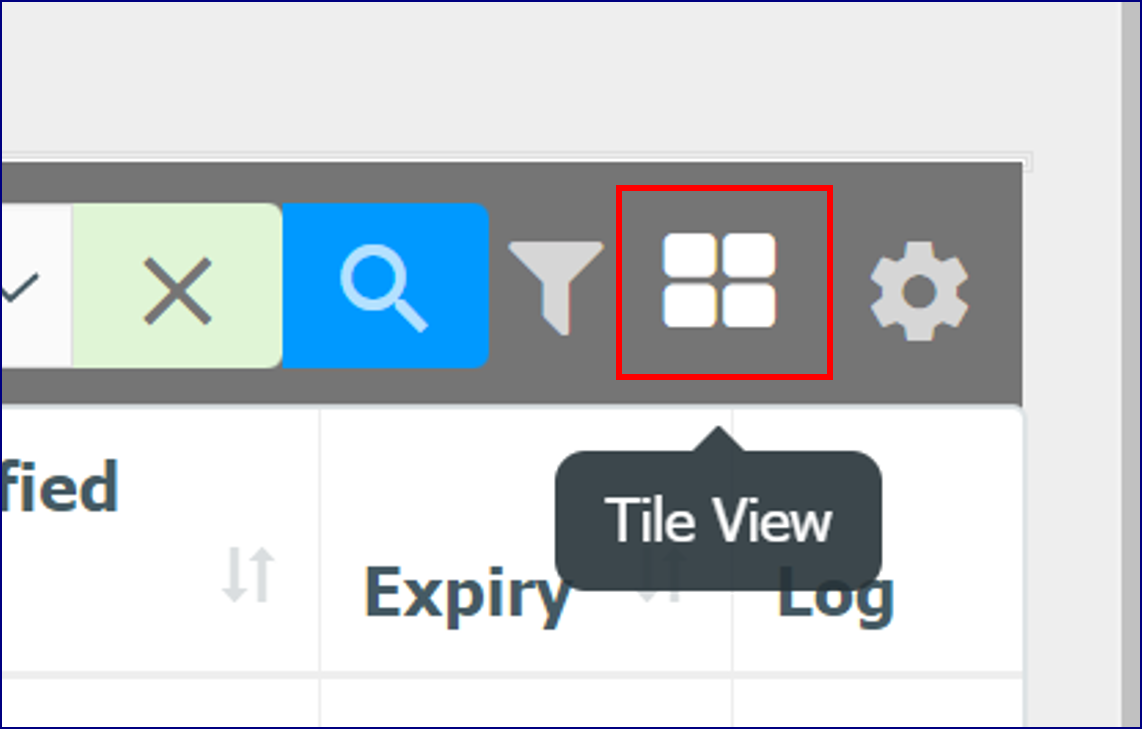
In 'Table View', click the Table/Tile View button.
The 'Tile View' displays.
Table/Tile Add or Remove
Columns
You can add or remove columns by hovering over the Settings icon within any table in the WebAdmin. This also works with the 'Tile' view.
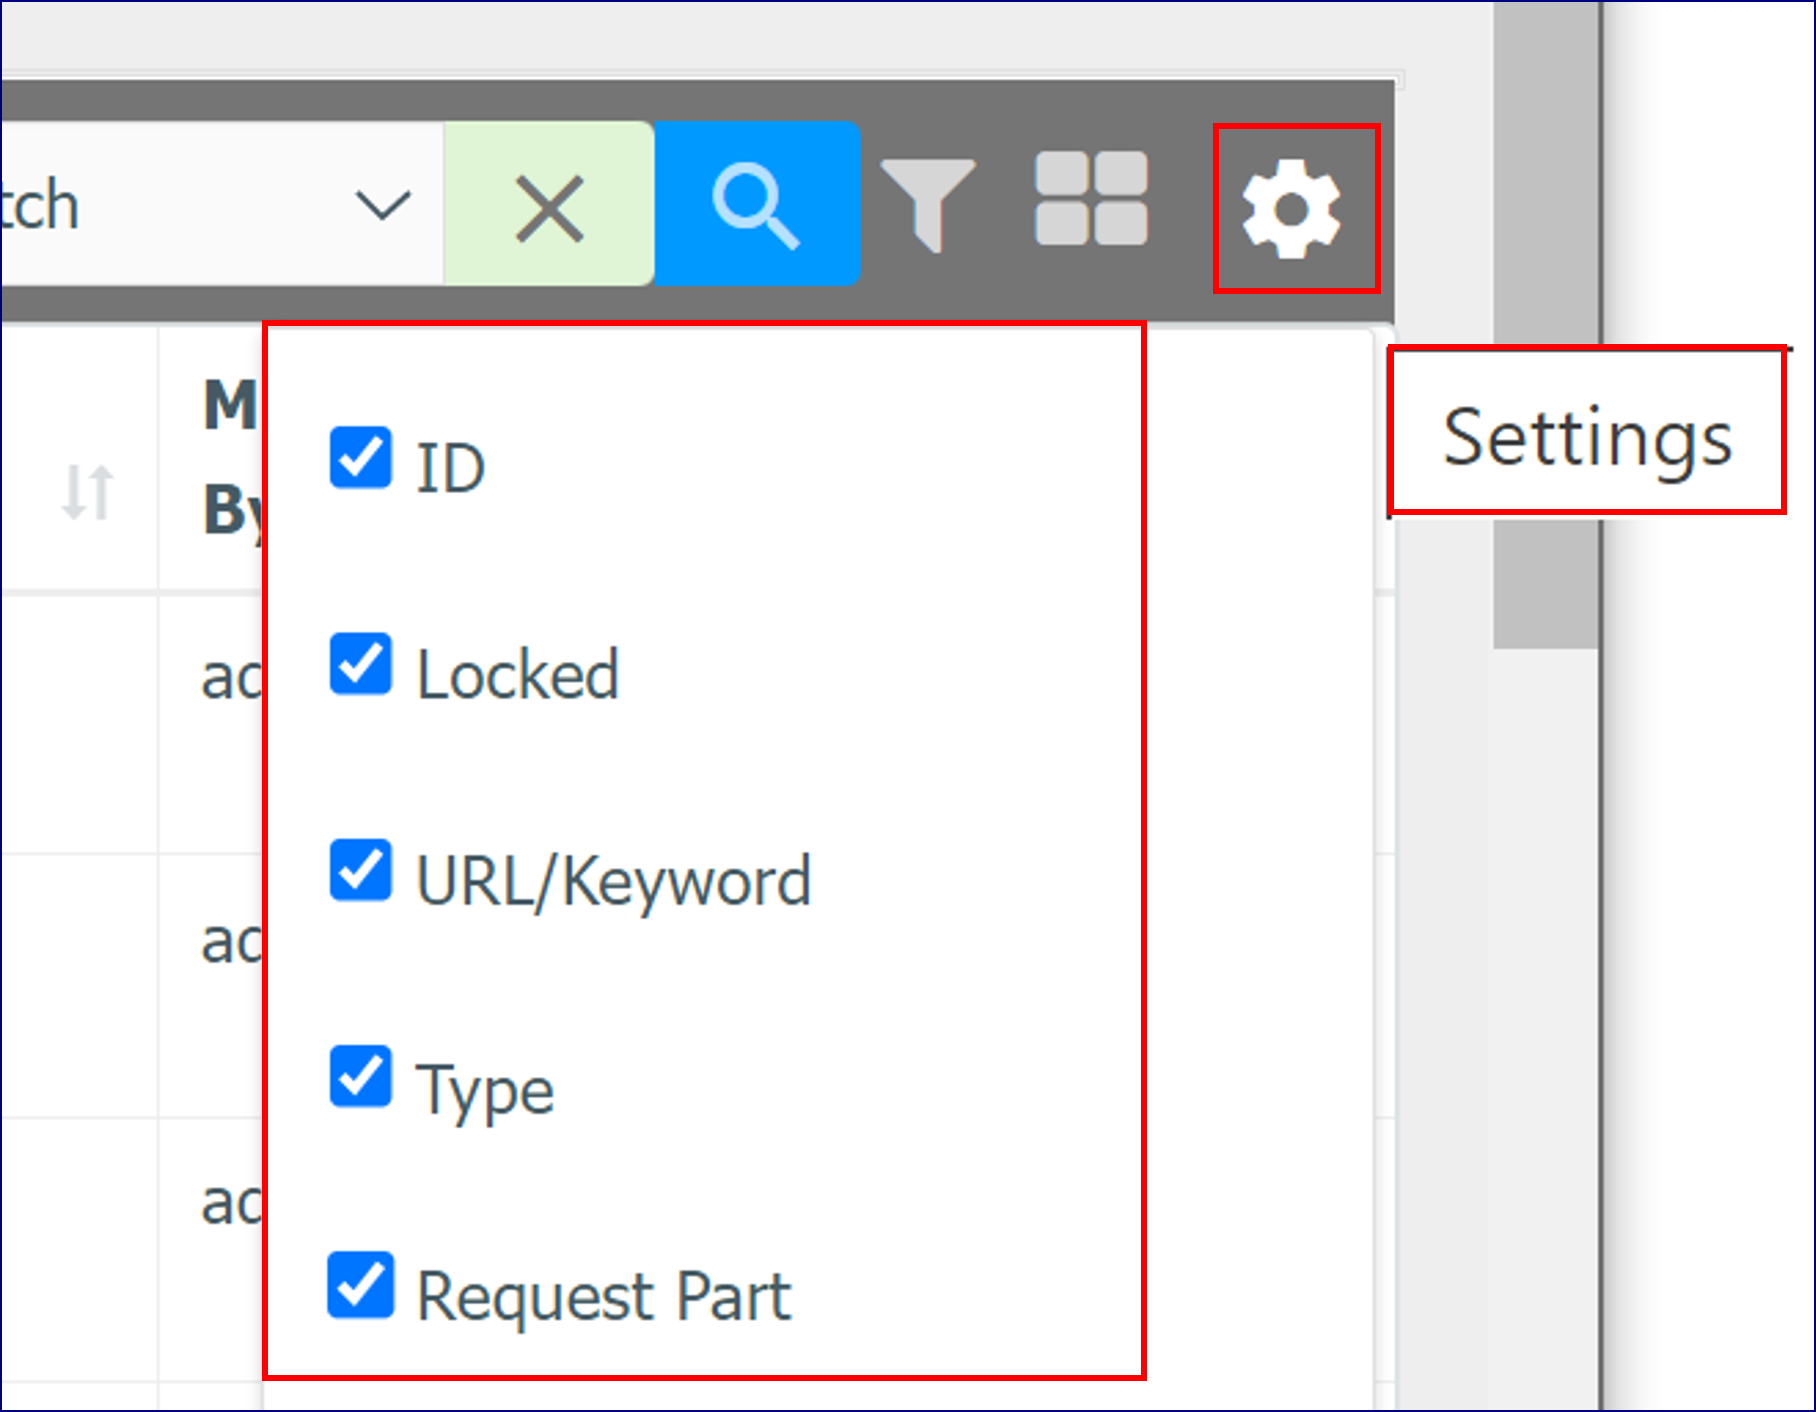
Both the Table and Tile views can be customized independently of each other for each applicable WebAdmin window.
WebAdmin Menu
Help
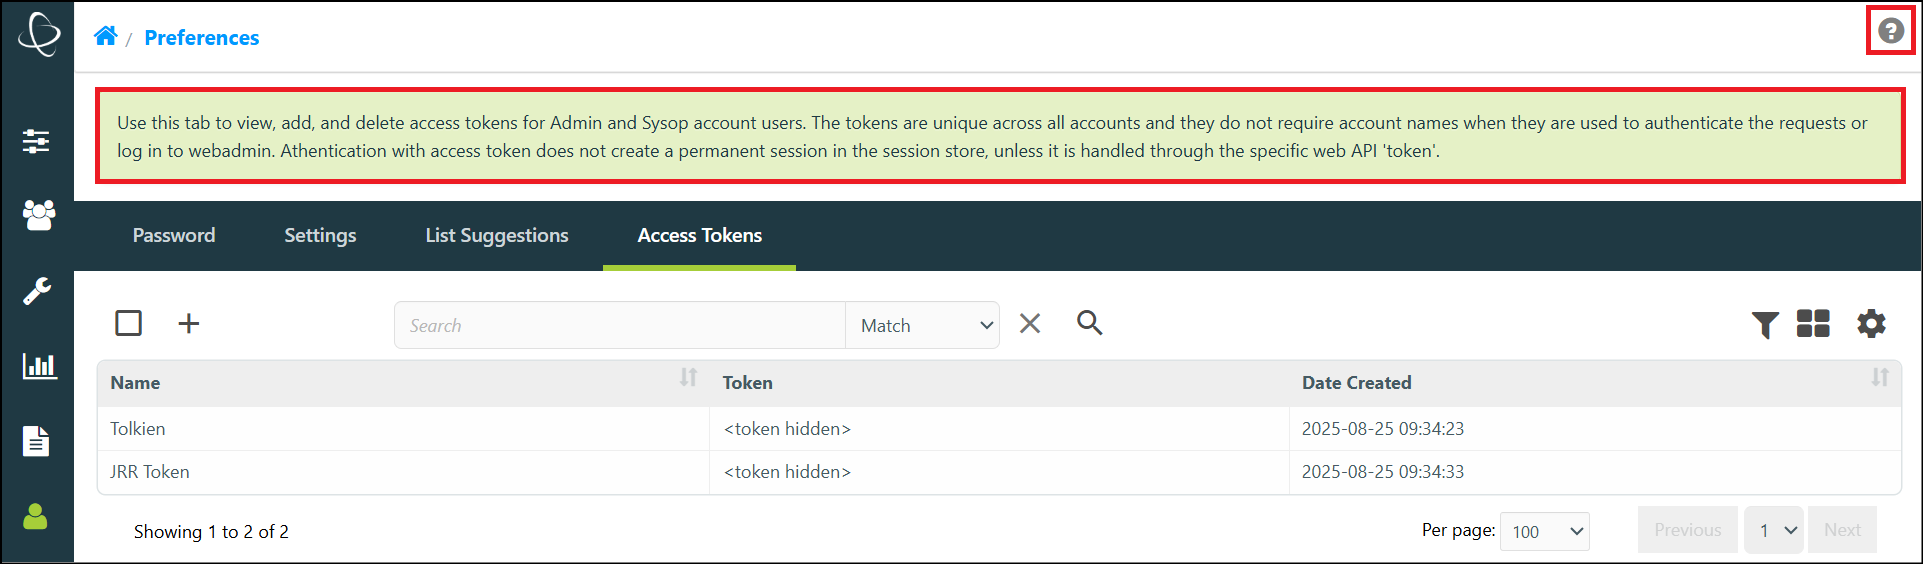
WebAdmin Topics have expandable help topics for all primary and secondary windows. You can expand these for more information or hide the help text to increase product usability. When you select the help (?) icon, the help text disappears if displayed. This setting is remembered the next time you open the page.
Search Window Options
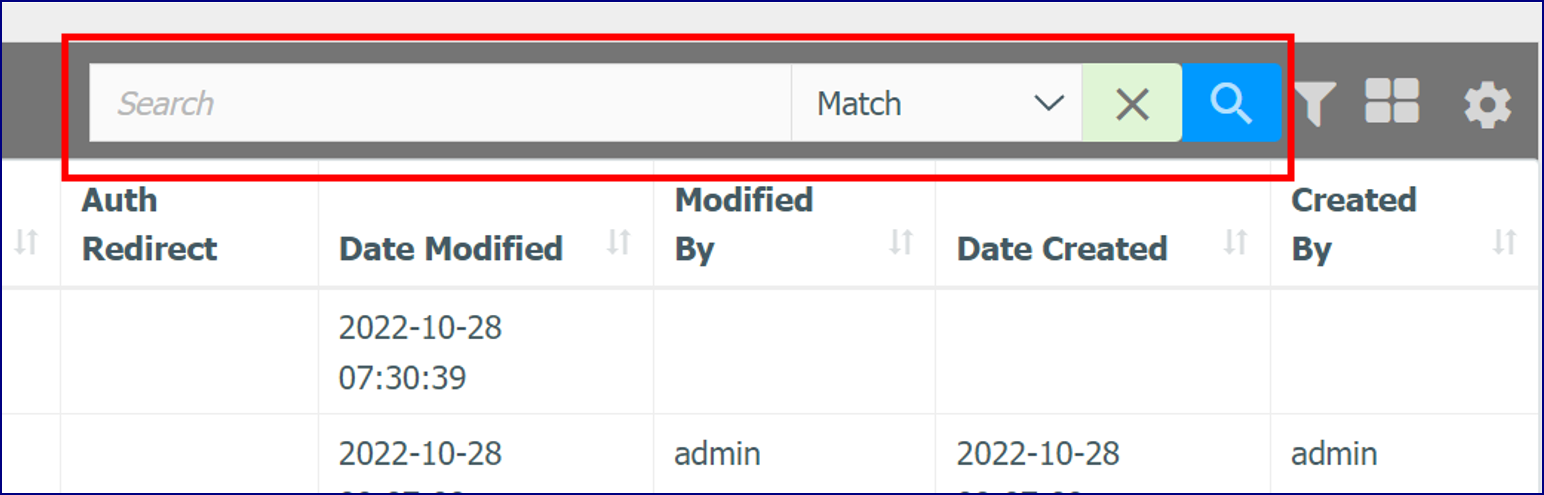
The 'Search' field has these options:
Search Window Options
The 'Search' field has these options:
|
Option |
Description |
|---|---|
|
Match |
The search displays an exact match. |
|
Exact Match |
This removes all wildcarding and the search must be an exact match to display results. You can also add wildcards to Exact Match searches. % and * are acceptable wild cards. |
|
Contains All |
This takes each space separated word and search for a match for each, if any are not found it will not be shown. |
|
Contains Any |
This takes each space separated word and search for a match for each, if any are found it will be shown. |
Multi-select
Options
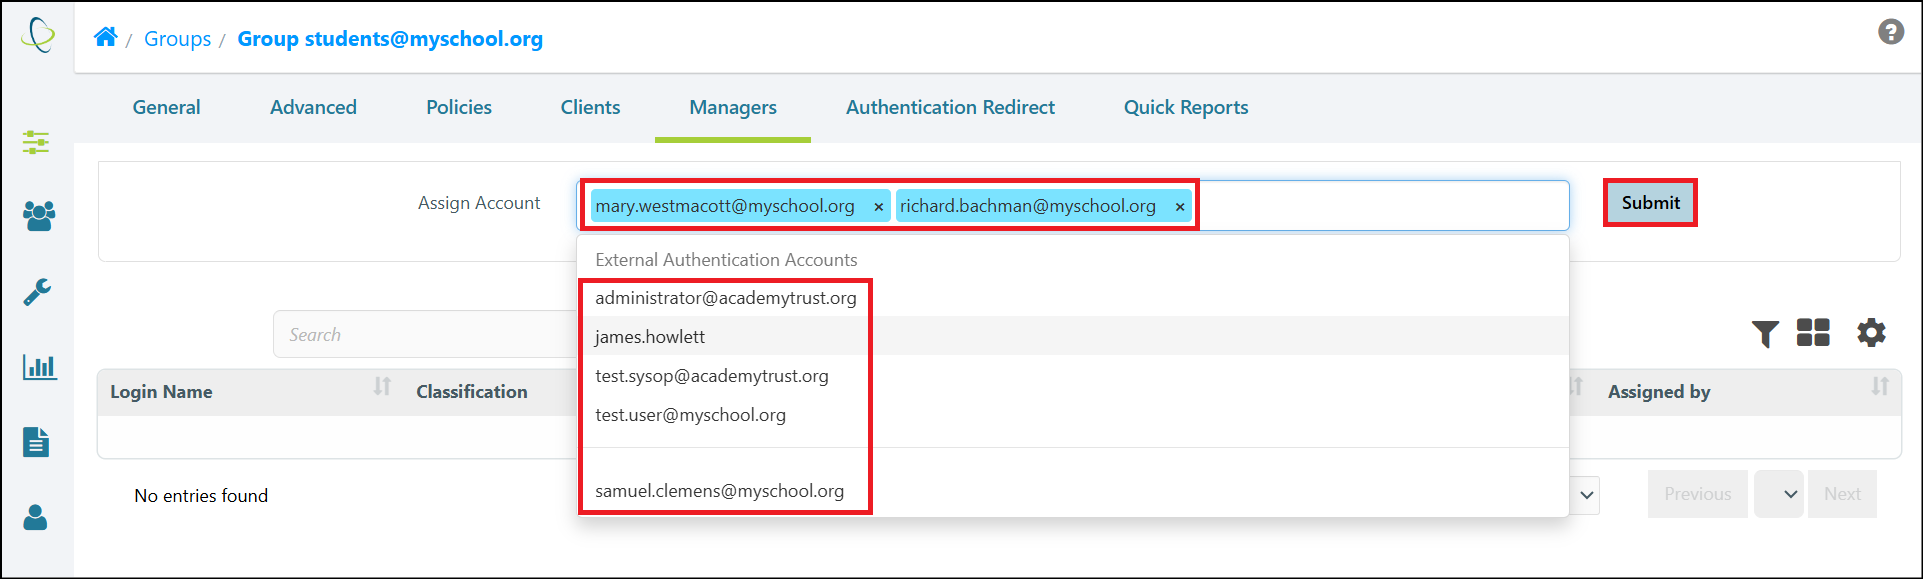
You can multi-select items from a dropdown list for inclusion in a single field.
Select
Number of Entries to Display on Page
There is a dropdown list to select the number of entries you wish to display on a page. You can also select the page number.
Header Toolbar
in the WebAdmin
The Header bar displays these items.
Multiple
Row Selection for Deleting Rows
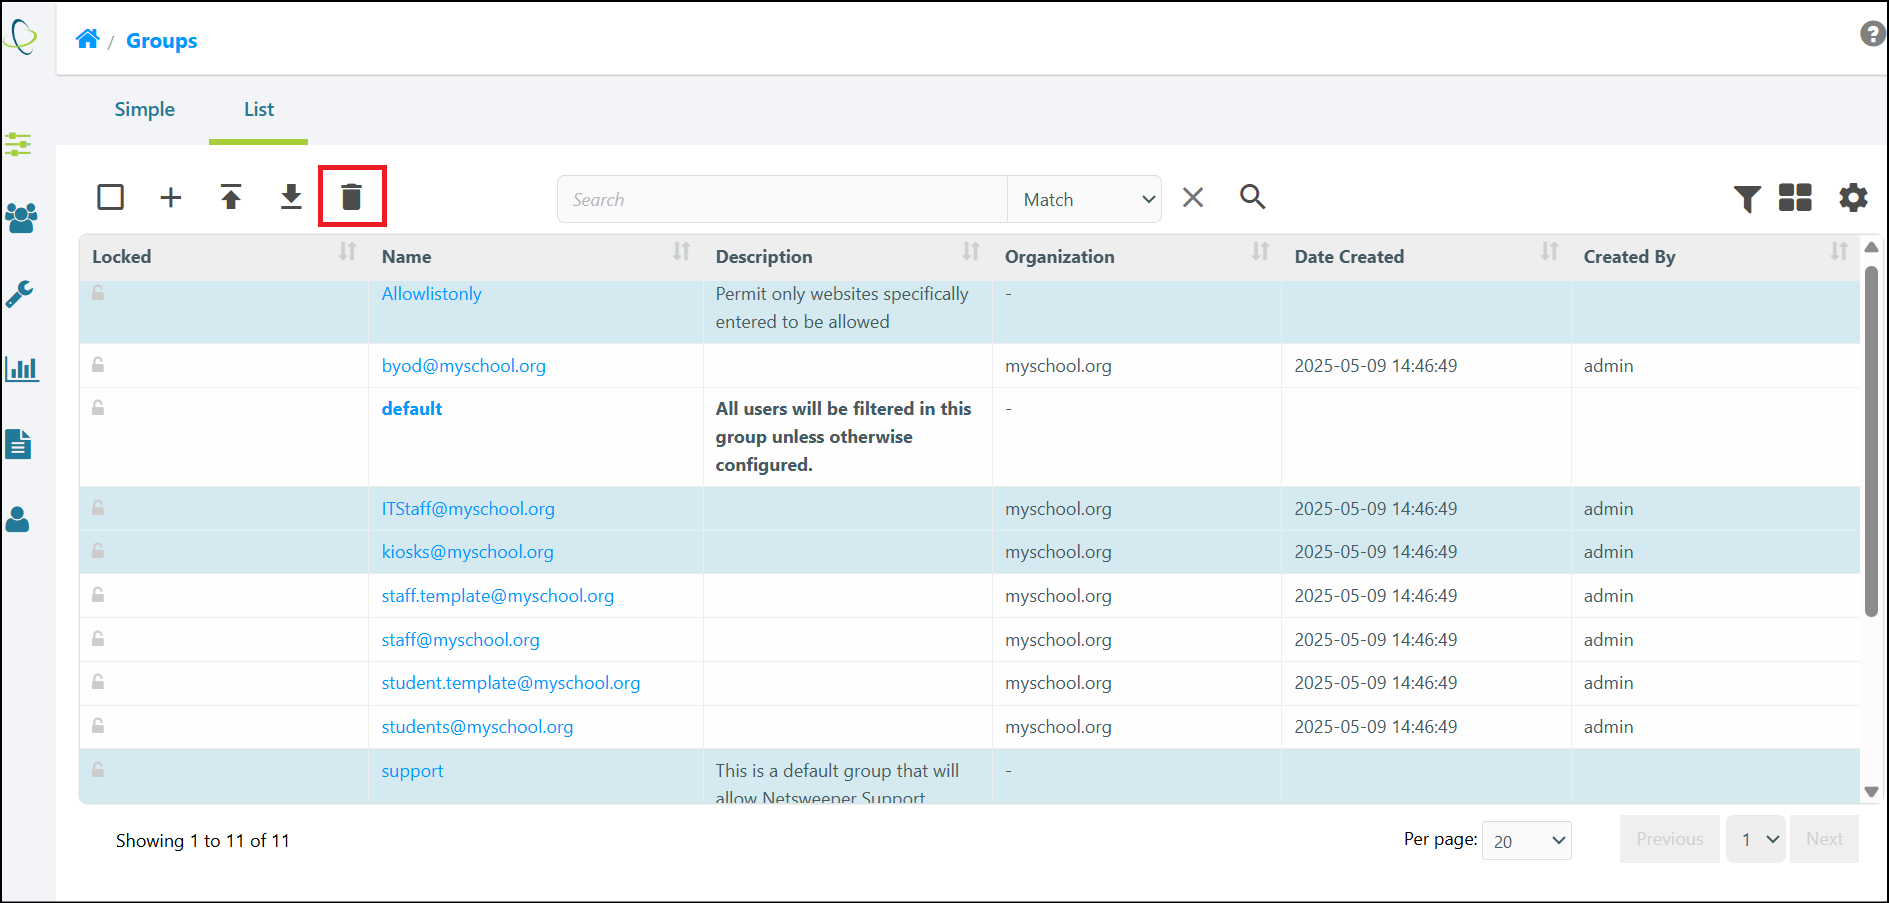
Select one or more rows and then click the Delete icon. You do not have to hold a <CTRL> key.
Quick Search
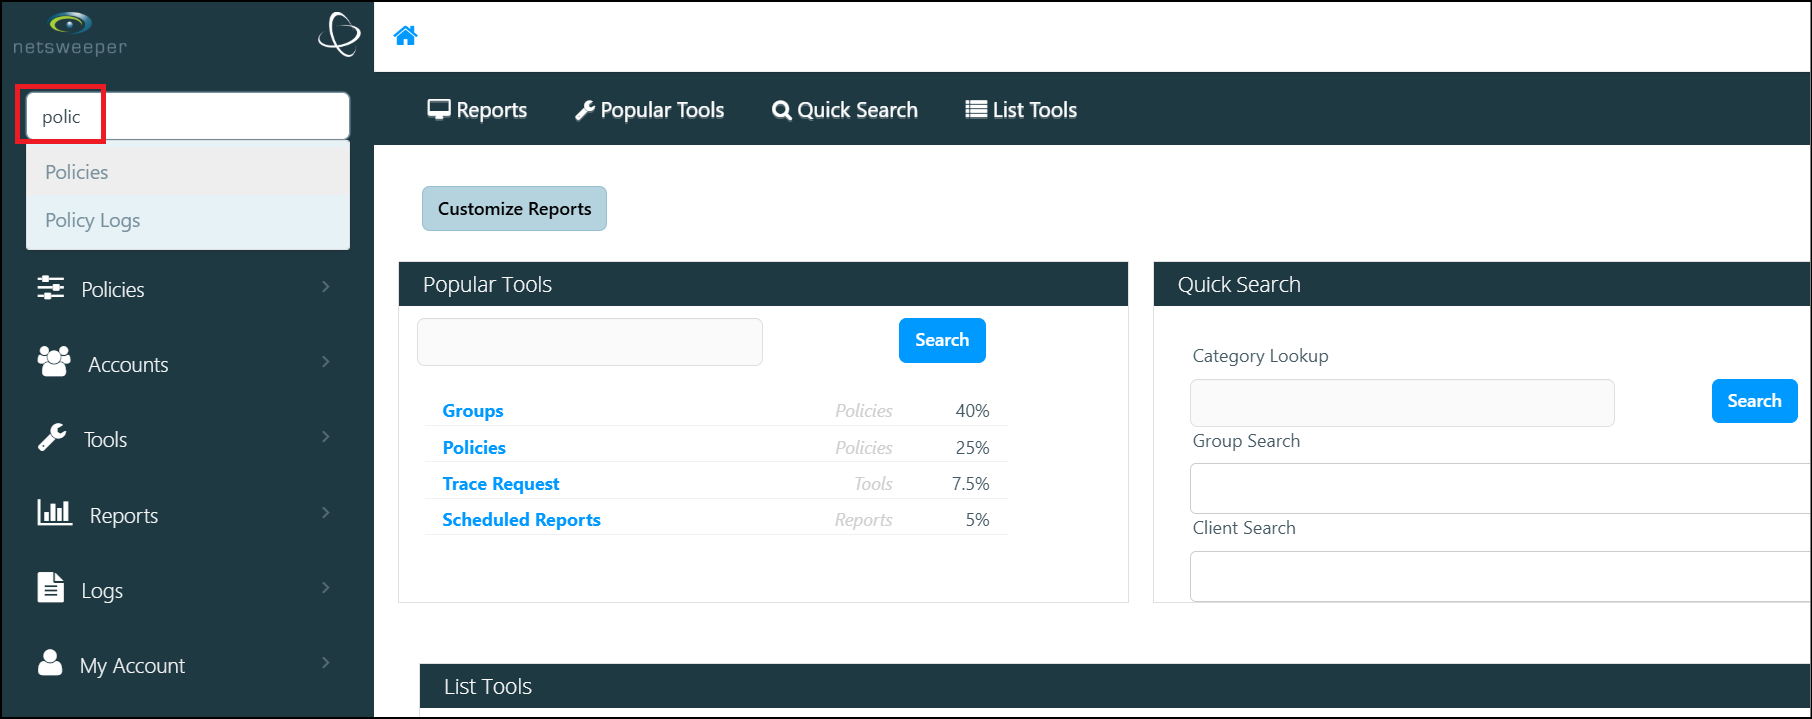
The Quick Search searches for pages and provides suggestions as you type so you can click the suggestion to navigate to the page.
Import and Export
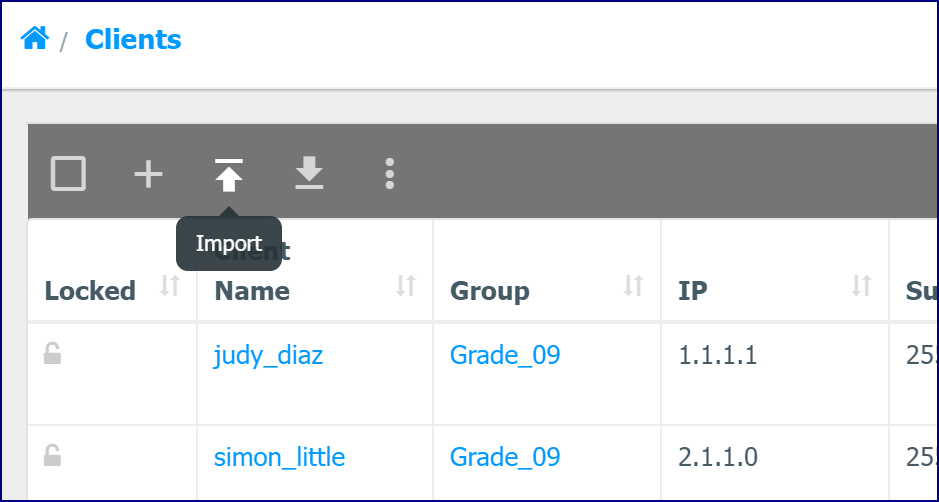
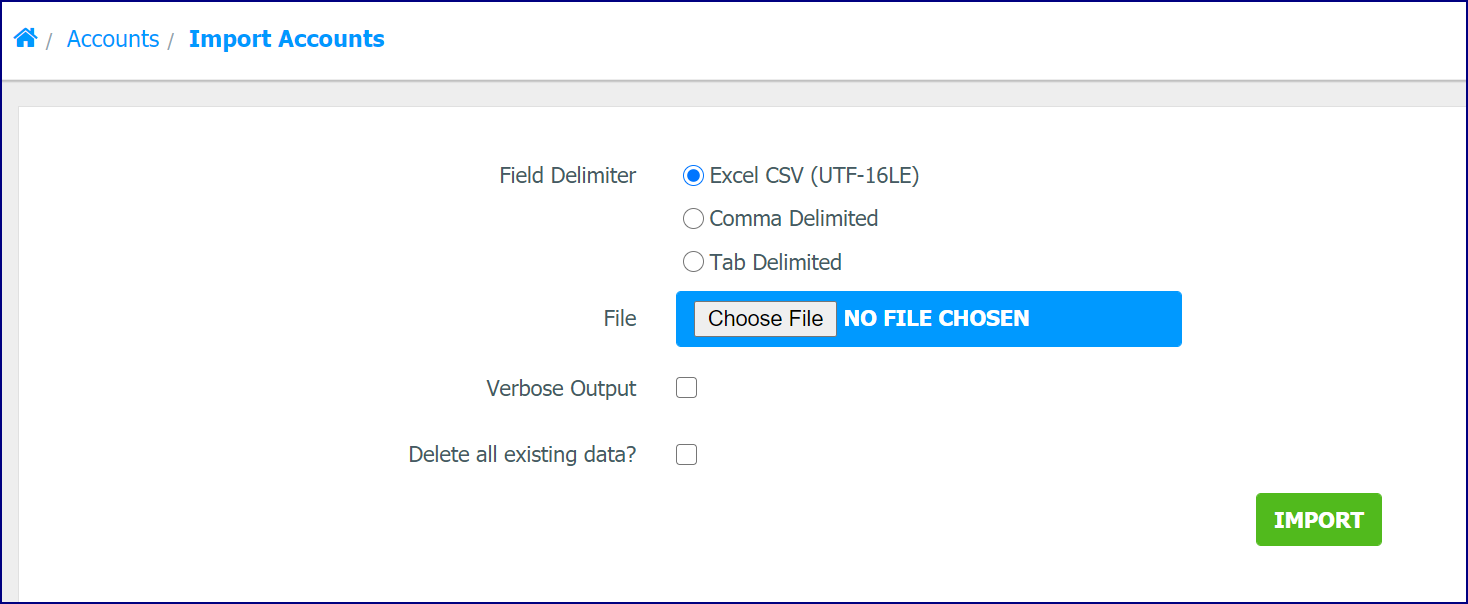
Most manager windows offer the option of importing or exporting the table.
Select whether the file is Excel CSV (UTF-16LE), Comma Delimited, or Tab Delimited. If there is a previous list that requires deletion, select the 'Delete all existing data?' checkbox. To keep the existing list, clear the checkbox. Click 'Choose File' and open the file you wish to use. The file you are importing will show in the 'File' box. Select the Verbose Output checkbox to show a line for each failed entry with the entry itself and the error description. When done, click the Import button.
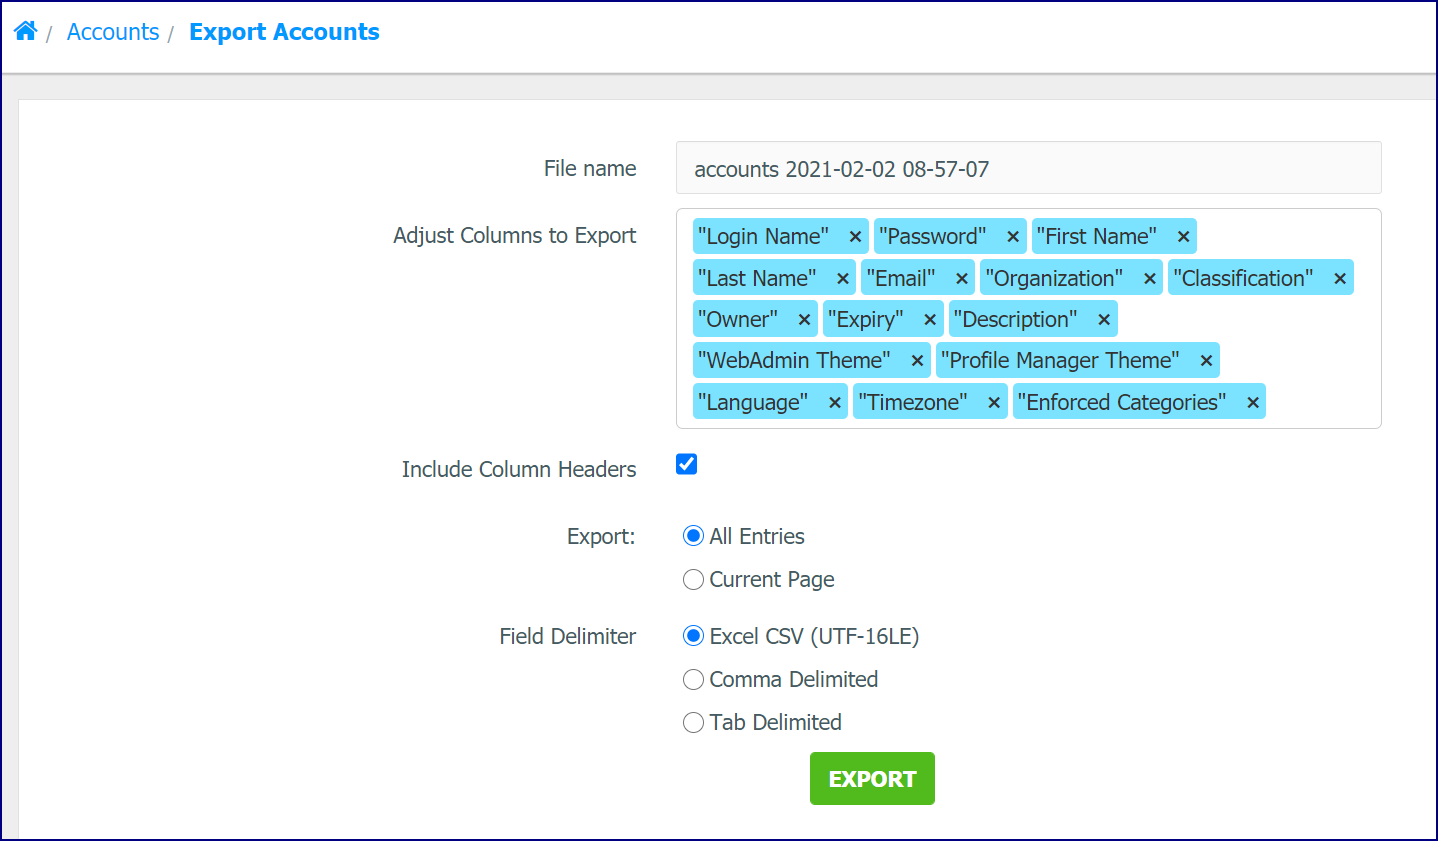
You can also export tables from many management windows. Adjust Columns to Export allows you to modify the columns to export or change the order the columns are displayed, and you can choose whether to include or exclude column headers. There are additional options that let you choose which rows to export. You can export as an Excel CSV (UTF-16LE), Comma Delimited, or Tab Delimited file.
Home Page Dashboard
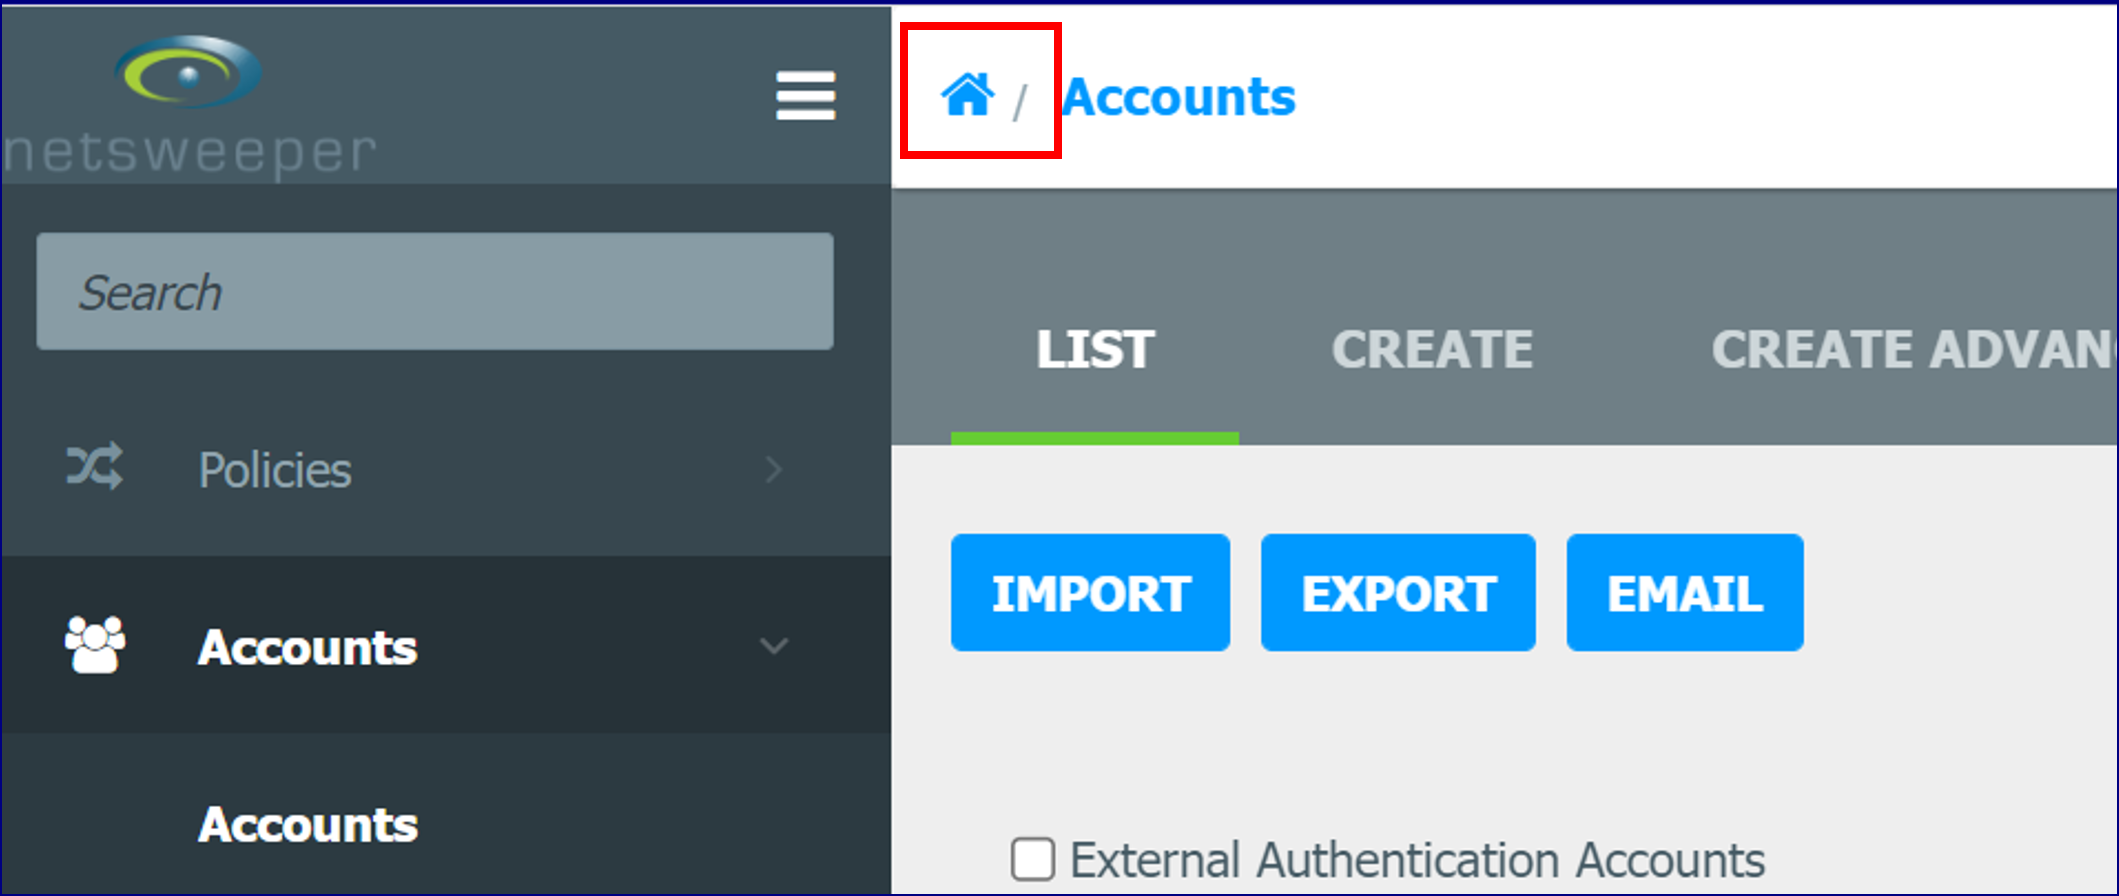
The Home page Dashboard can be accessed from anywhere in the WebAdmin by clicking the Home Icon in the breadcrumbs at the top of the windows.
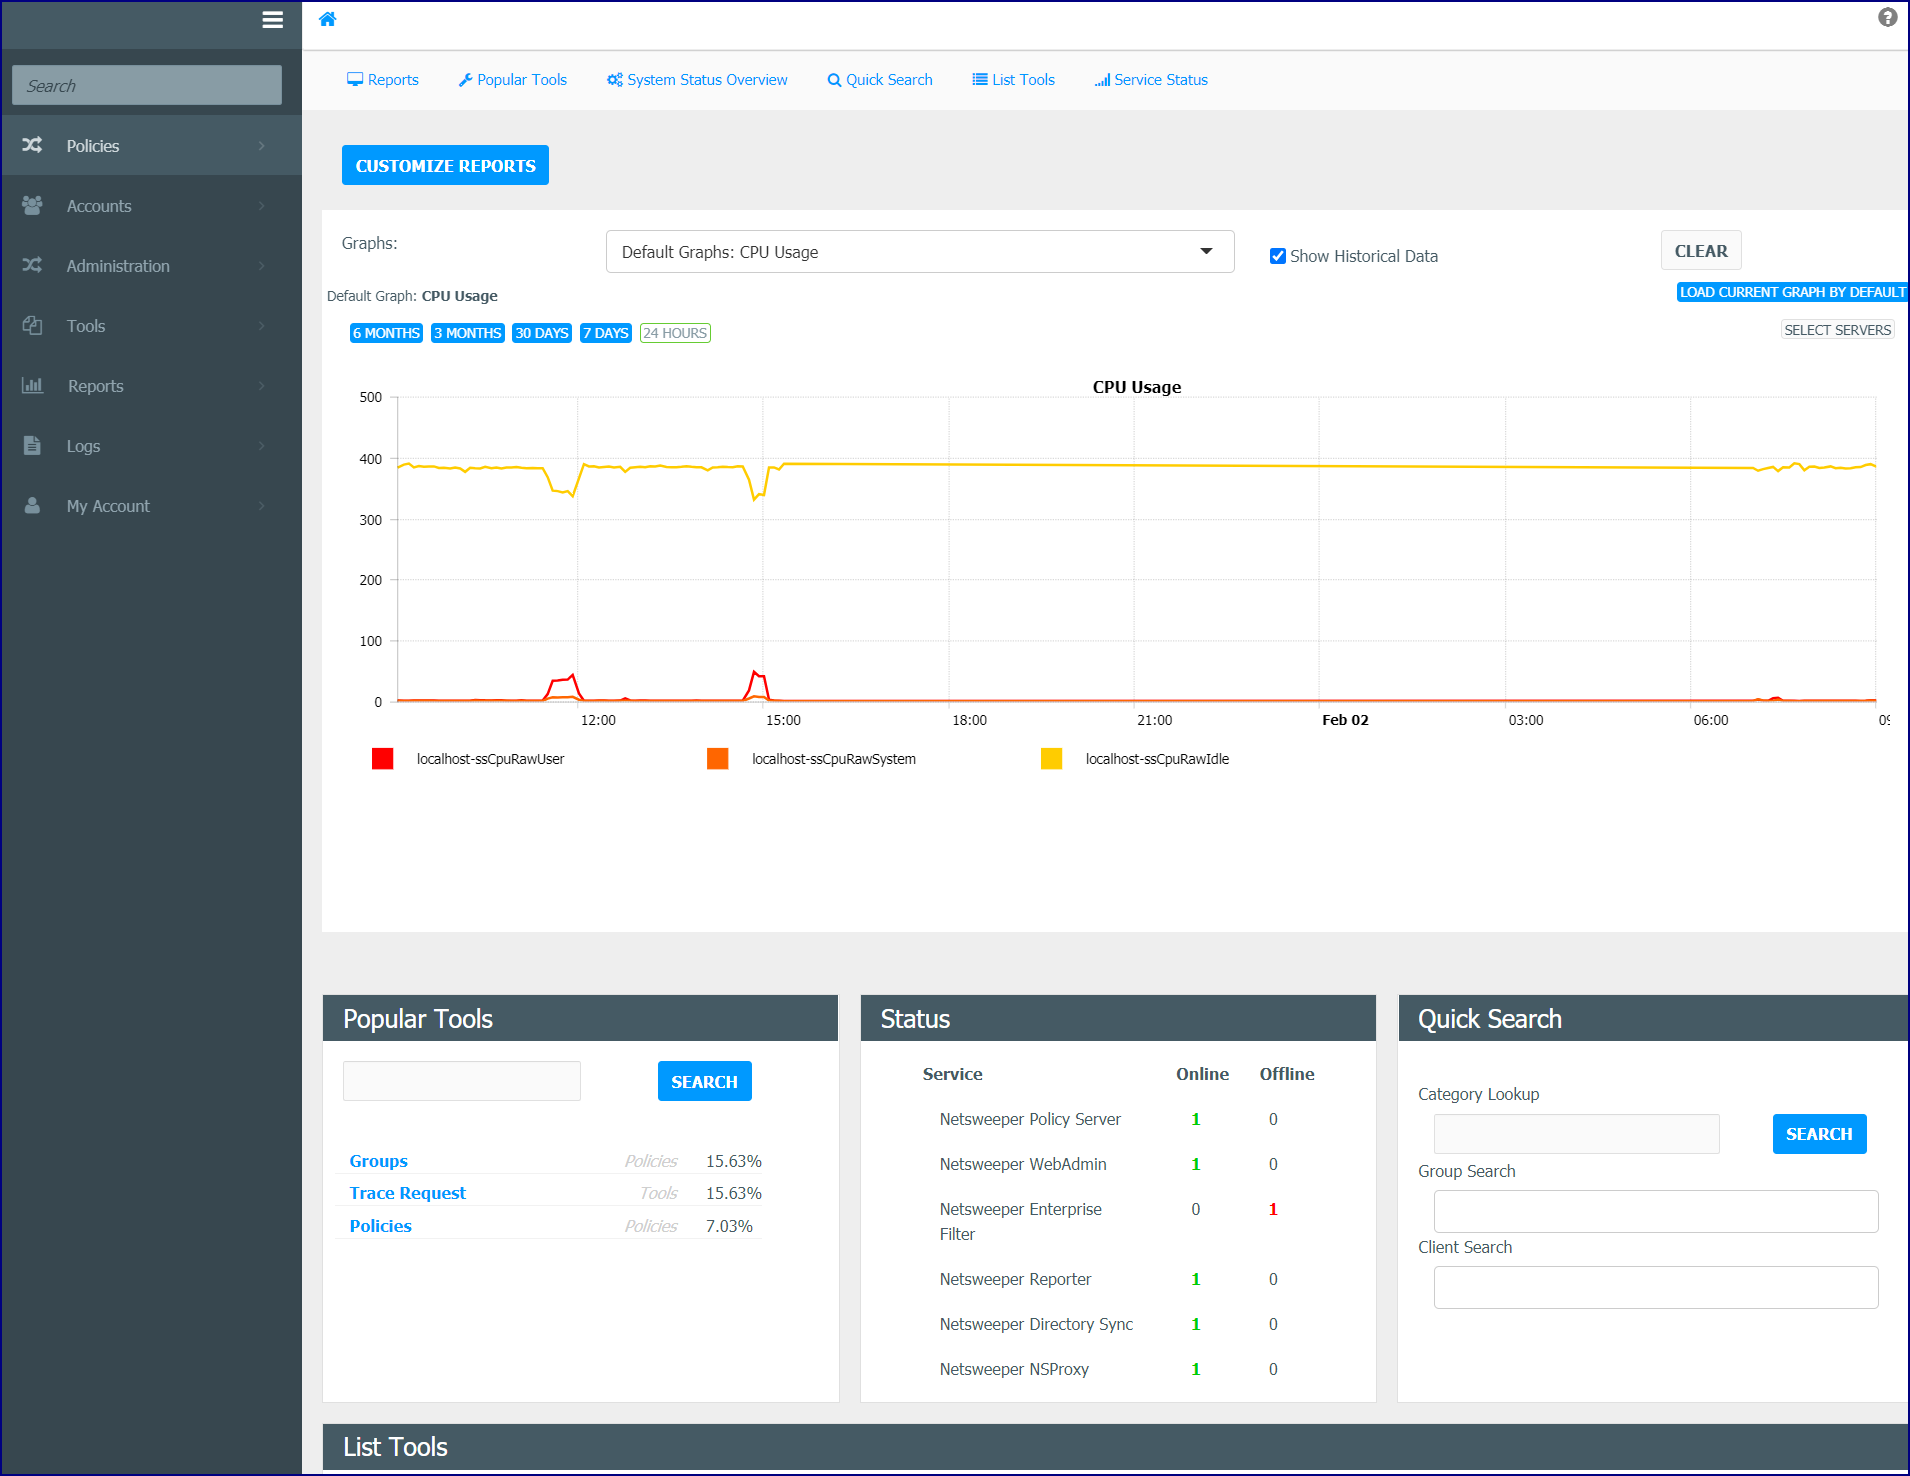
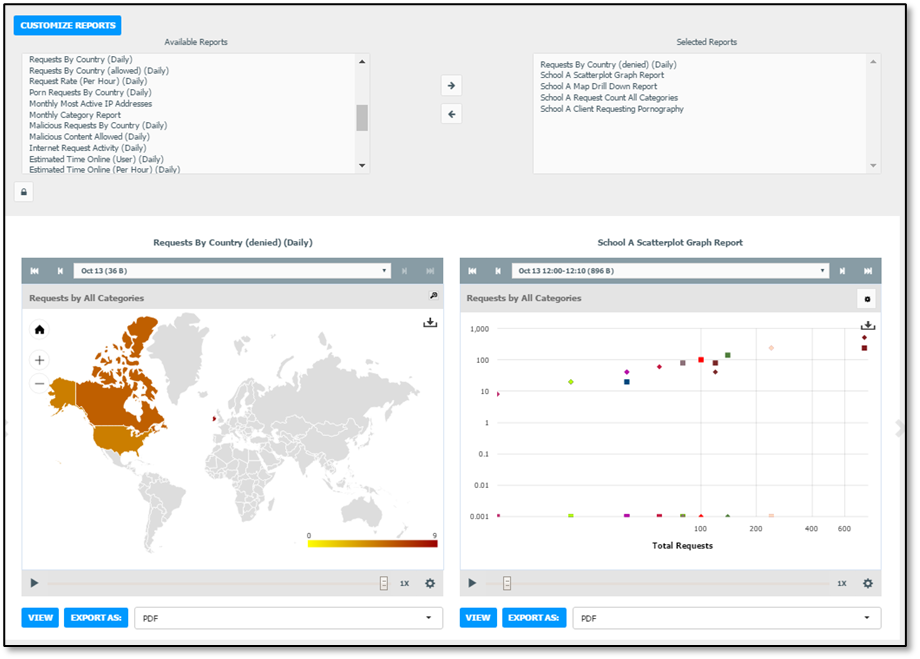
provides quick access to frequently used tools, Real-Time graphs, Monitoring Graphs, reports, as well as ‘Service’ and ‘System Status’ displays. Use the side panel navigation bar to scroll vertically to the different displays. Real-Time graphs and Quick Reports show at the top of the window. Click Select Servers to select the servers you wish to monitor. All servers are displayed by default. Click the lock icon to show the current panel when the dashboard loads. The Customize Reports button lets you add or remove Reports from the carousel display. In addition, you can add List entries or search URLs, Groups, and Clients.
Breadcrumbs
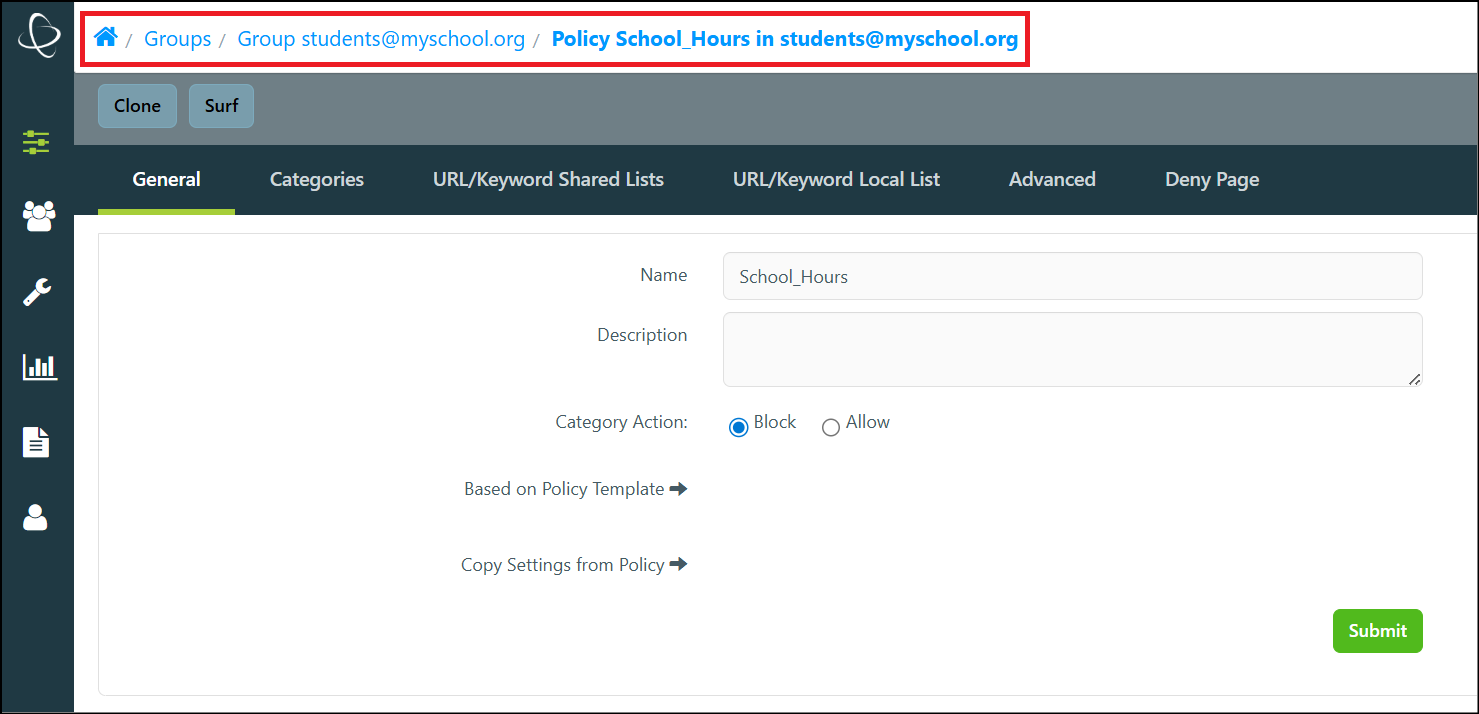
Breadcrumbs at the top of WebAdmin windows can be used for more intuitive page navigation through the WebAdmin hierarchy. The Home icon allows access to the Home Dashboard.
Restore
Session Data on Login
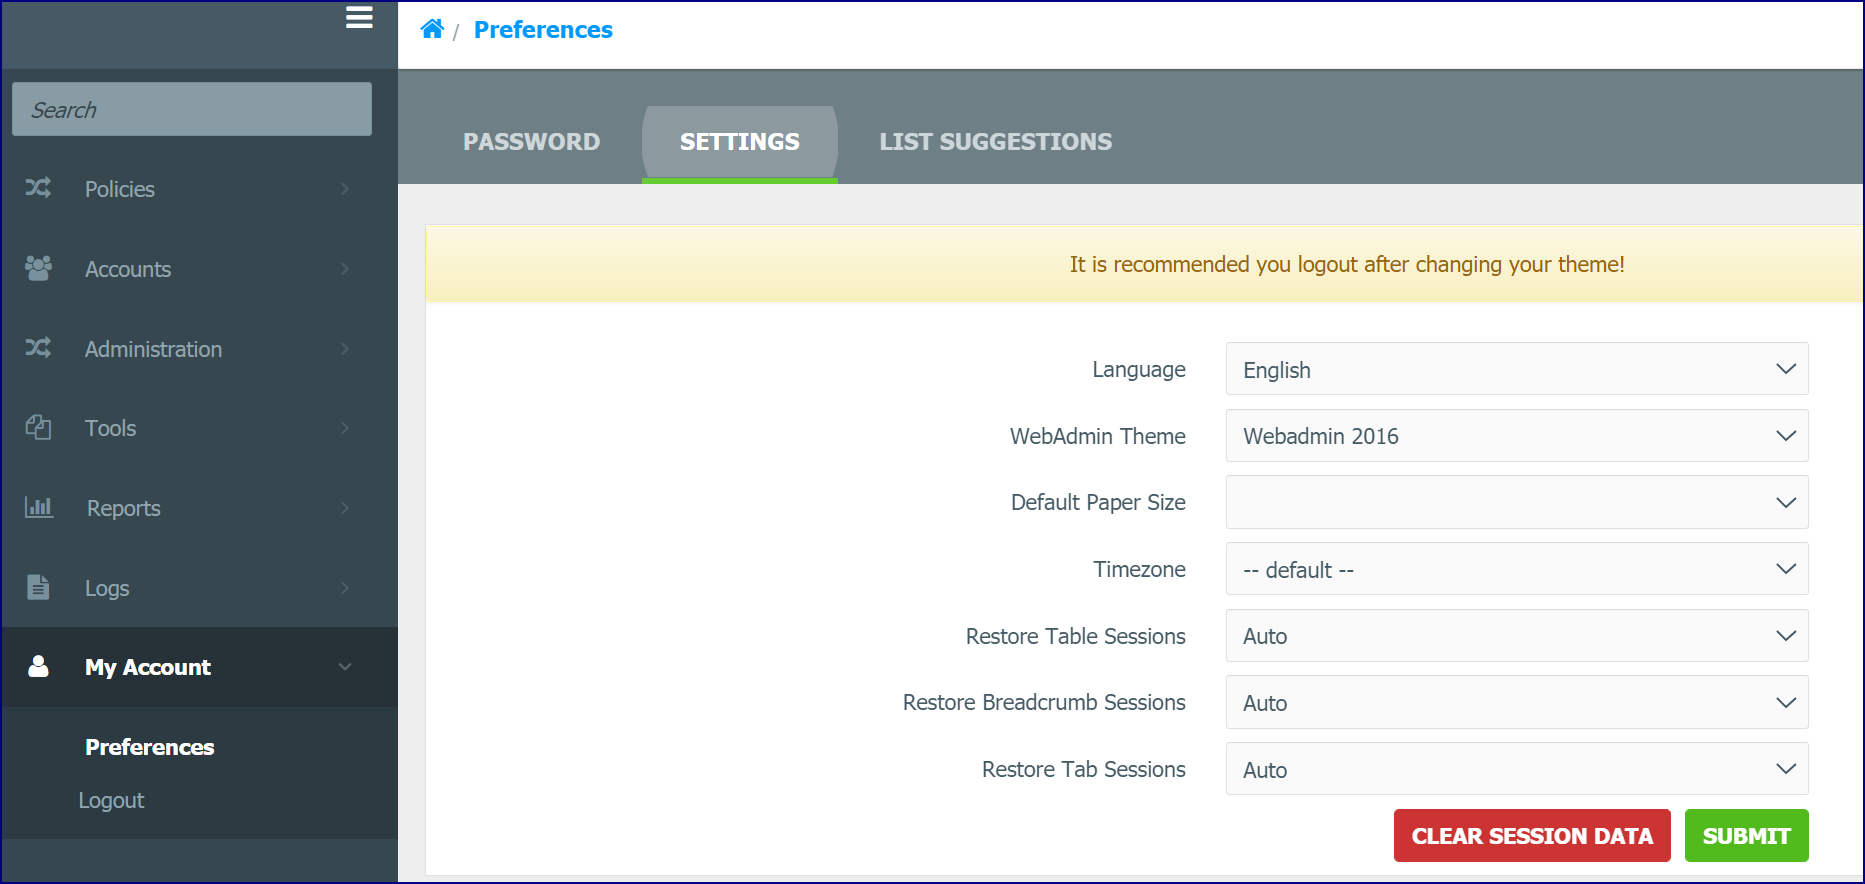
In Session Settings, you can select how specific session settings can be restored. Each Restore option can be set to Auto, Prompt or Manual. In addition, the Session Restore option can be disabled.
- Auto: The Session Restore functionality will be performed automatically after logout.
- Manual: A Restore Session button appears in 'Session Settings' window.
- Prompt: A Restore Session link displays in the top right corner of the 'Home' page.
- Disabled: Do not store Session information.
When Breadcrumbs are restored, you will be returned to the last visited window with the same breadcrumbs you had in your previous session.
Mobile Menu Bar
When sizing the WebAdmin window or when using on mobile devices, the Menu Bar shows as the collapsed menu icon.

Expand/Collapse
Page Browsing
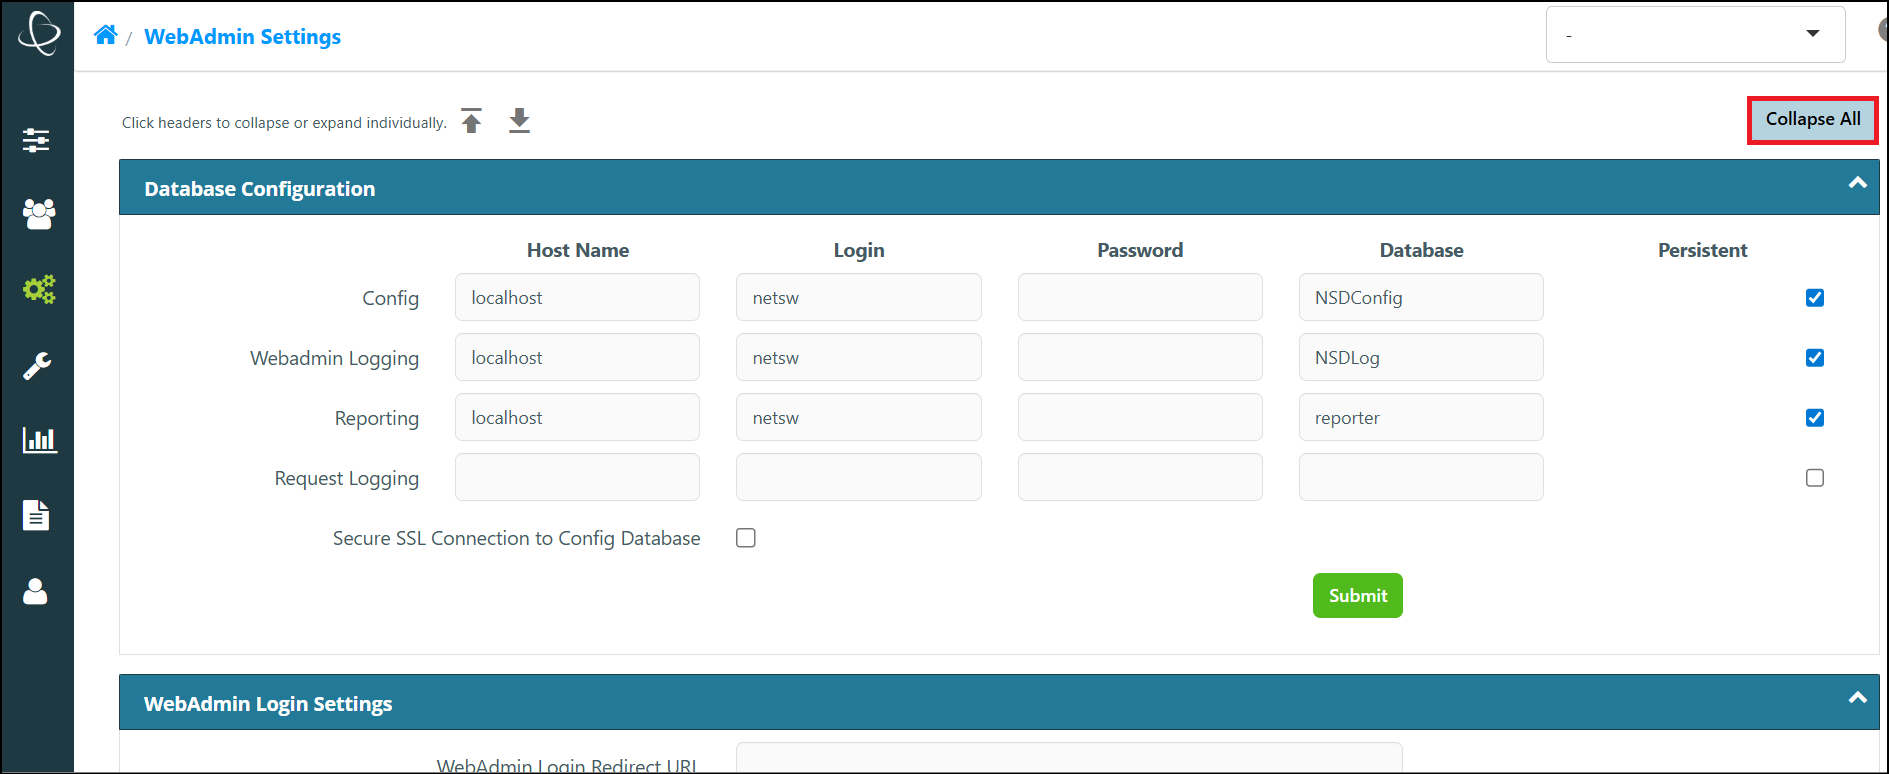
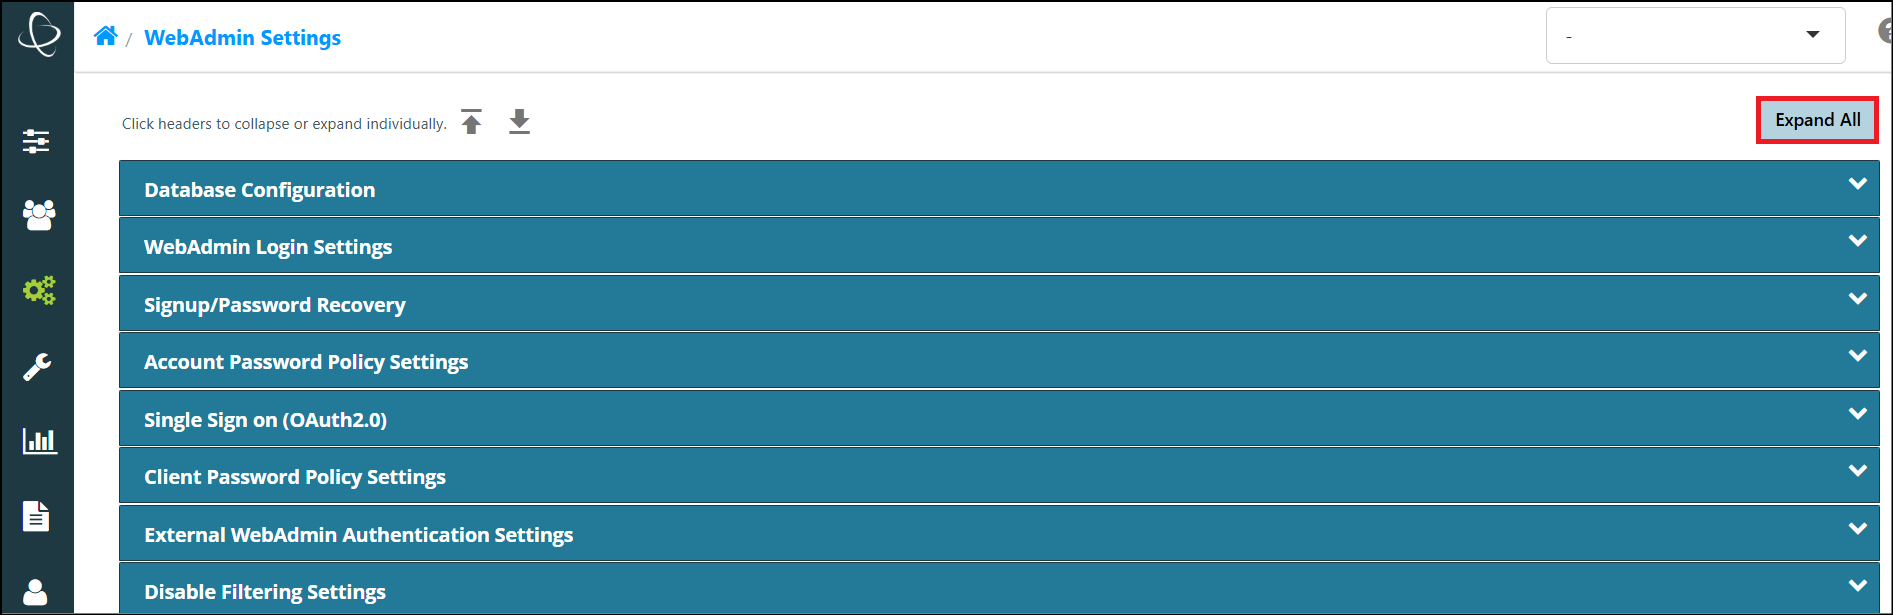
Expand/Collapse buttons can be used for easier browsing and searching.
Quick
Add for Category Selection
The ‘Quick Add’ function has an autocomplete feature. Click the Quick Add search.
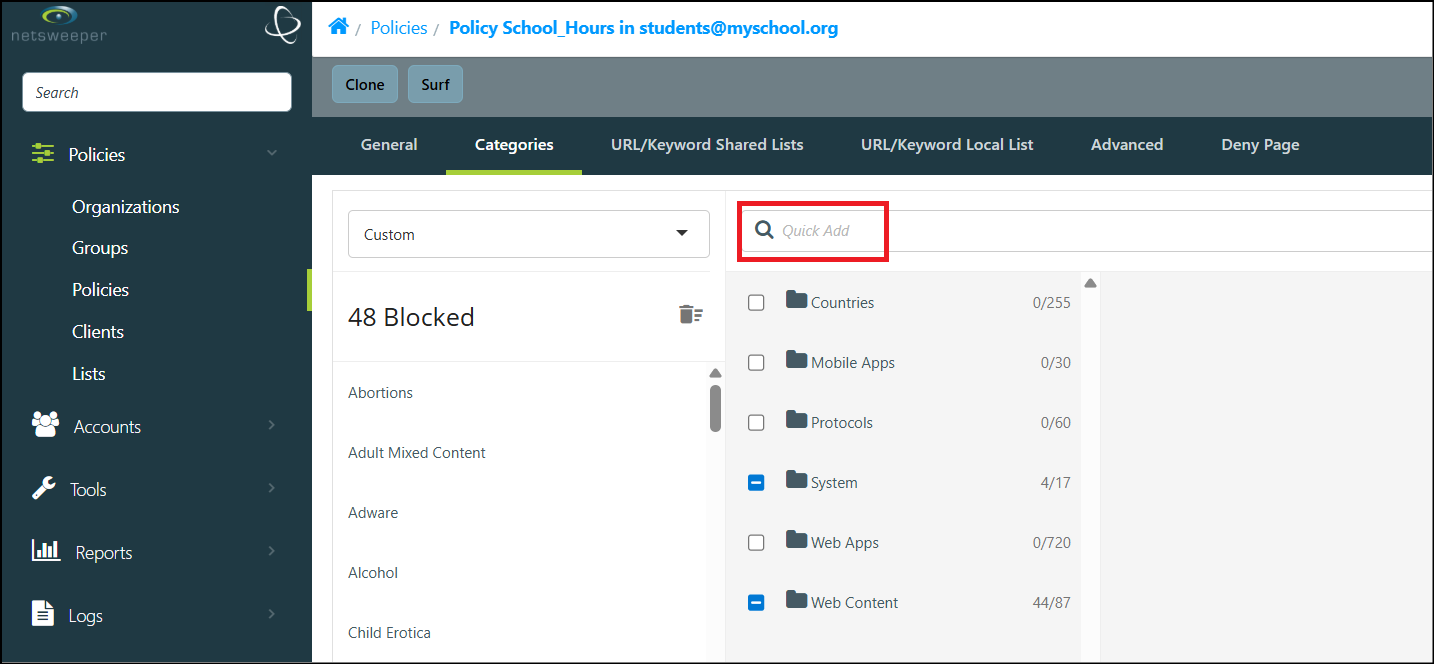
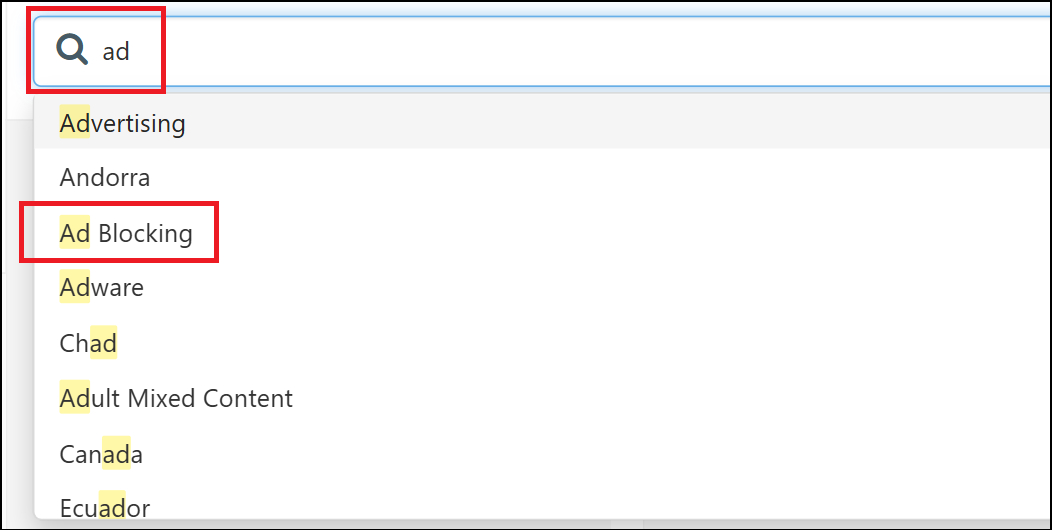
You can type the name of the Category and quickly add it as your Category selection. You can also select and add the Category from the dropdown.
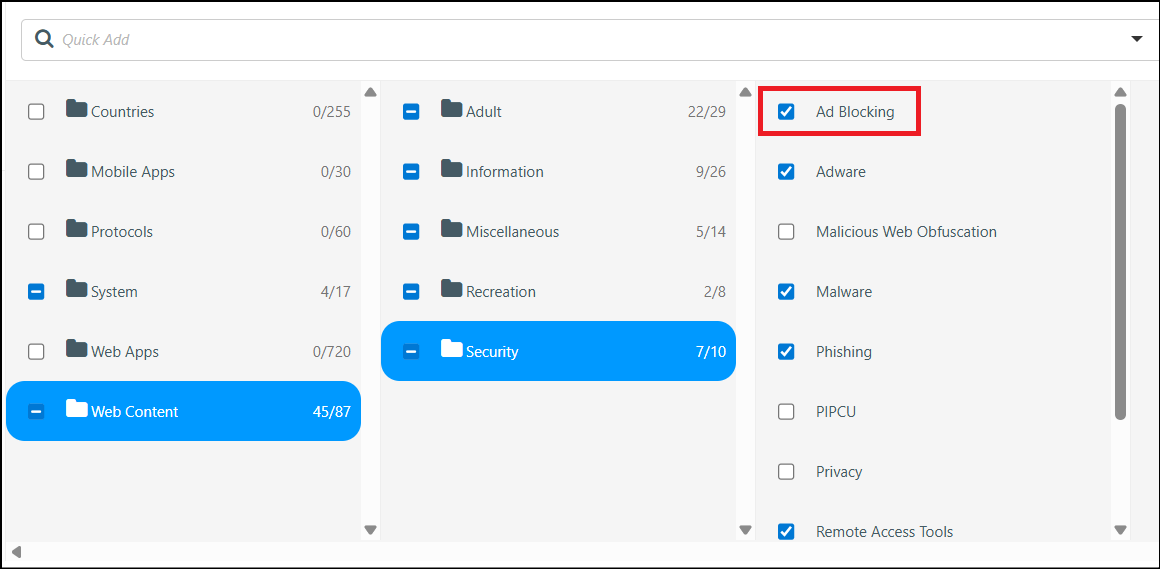
As you type and select, the Categories are added to the list on the left.
Auto Complete
and Wild Cards in Search Fields
You can search for items on WebAdmin pages by simply typing in the field. The autocomplete feature will display the entry and filter the list.
When searching within the WebAdmin a backslash (\) is required for percent (%) and backslash (\) characters. A percent without a backslash will act as a wildcard. Please note that there is different search functionality in 'Request Logs' searches.
Special
Characters in the WebAdmin
This section contains information on the use of special characters in the WebAdmin.
· Group names can only contain characters from the set:[A-Za-z0-9_@.+'#|-].
· Client names can only contain characters from the set:[A-Za-z0-9_@.=\ +'#|-].
The following special characters
· Please note that the name '-' (hyphen) is reserved for undefined Client names.
· The pipe character ( | ) is typically seen by most fields in the WebAdmin as an OR operator.
Real-Time
Graphs and Quick Reports
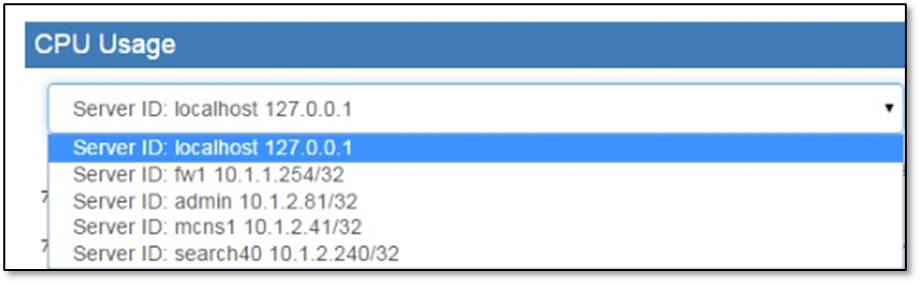
Real-Time Graphs and Quick Reports use a scrollable 'carousel' on the Home page. Click the arrow buttons to the right and left of the graphs to scroll horizontally across the window. A dropdown list allows you to select the servers you wish to monitor. The selection defaults to the first server on the list. Hovering over these charts displays additional information. Use the Customize Reports button to add Quick Reports to the display.
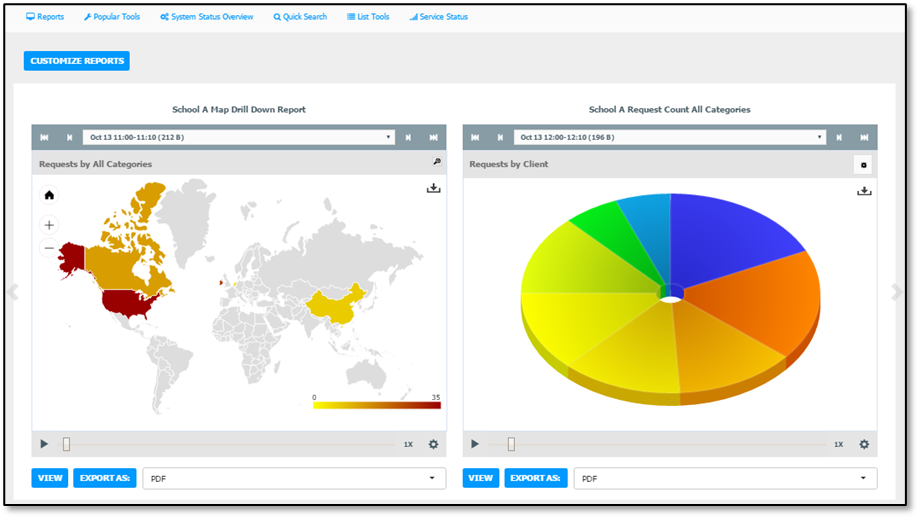
Customized
Reports in the Home Page
The Customized Reports button expands to show a list of ‘Available Reports’. Click to add Quick Reports to the scrollable carousel on the Home page. Click the lock icon to show the current panel by default when the dashboard loads.
Graphs: CPU
Usage and Request Rate
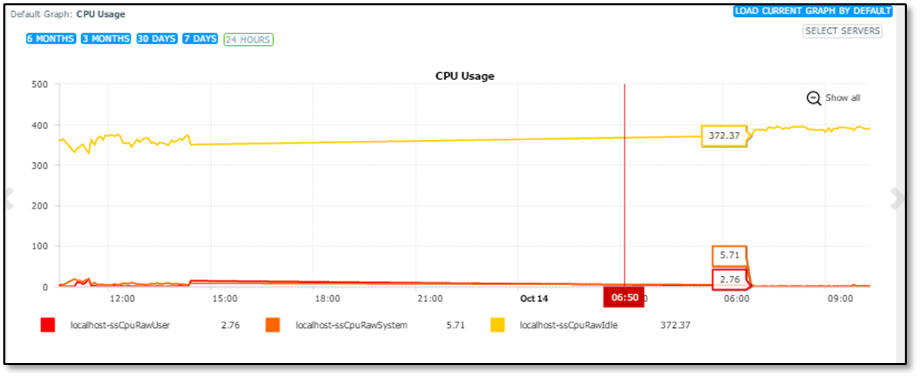
There are graphs on the Dashboard showing CPU Usage and Request Rate.
CPU Usage
Requests Processes
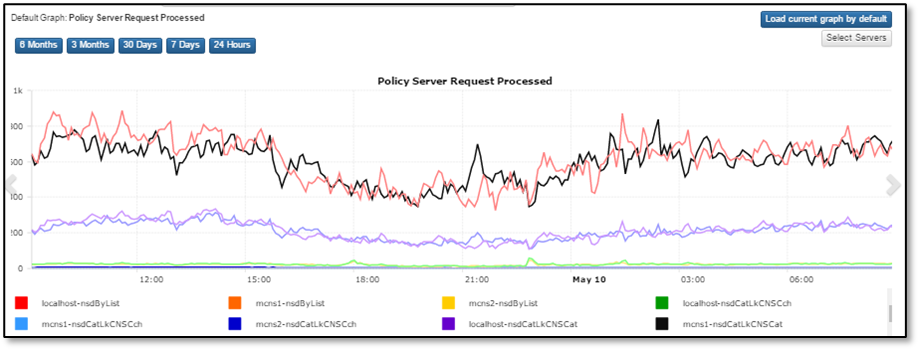
Click the ‘Select Servers’ button to choose which servers you would like to view. All available servers are shown by default. Customizing the server selections can improve processing time and allows the user to view the specific data they need without cluttering up the graphs.