Logger Service
During normal operation, this is how the process flows:
-
Log entries are queued up as they are generated.
-
This queue is periodically emptied and the entries in the queue enter the logmod5 graph as a packet (bundle) of entries.
-
-
The packet starts at the lm5_entry node and moves through the graphs via connections.
-
The packet reaches an end point and is processed in some way.
-
For example:
-
Written to nslogger_request.log log files
-
Sent to a remote logger
-
Stored temporarily to be processed later
-
-
This diagram explains in a little more detail:
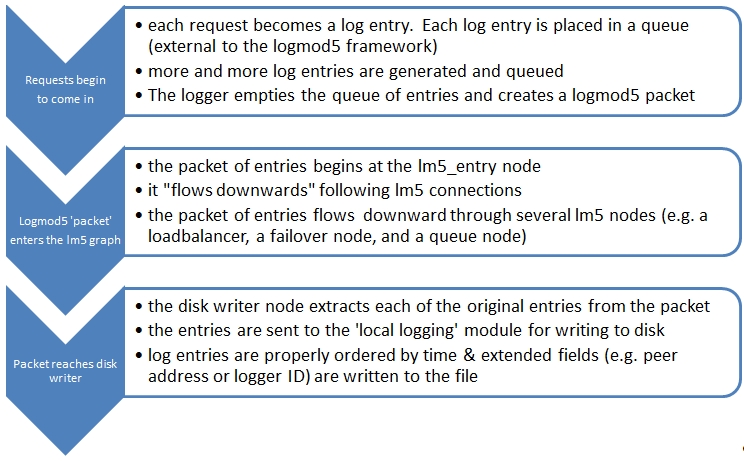
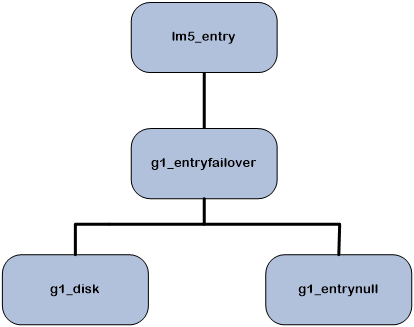
The default configuration is a simple configuration that logs all entries to the local disk. By default, we will use a maximum of 5 gigabytes of disk space utilizing many log files that are required until this maximum is reached.
For further information on configuring LogMod5, please see: 'Configuration - LogMod5'.
The Logger Service
Inputs Logging
Inbound Ports Logging
Below is a list of inbound ports that the logging service uses.
|
Port |
Protocol |
Comments |
|---|---|---|
|
3000 |
TCP |
Remote logging packets received on this port. |
|
3434 |
TCP |
Remote administration commands. |
Logging and the nsd.conf
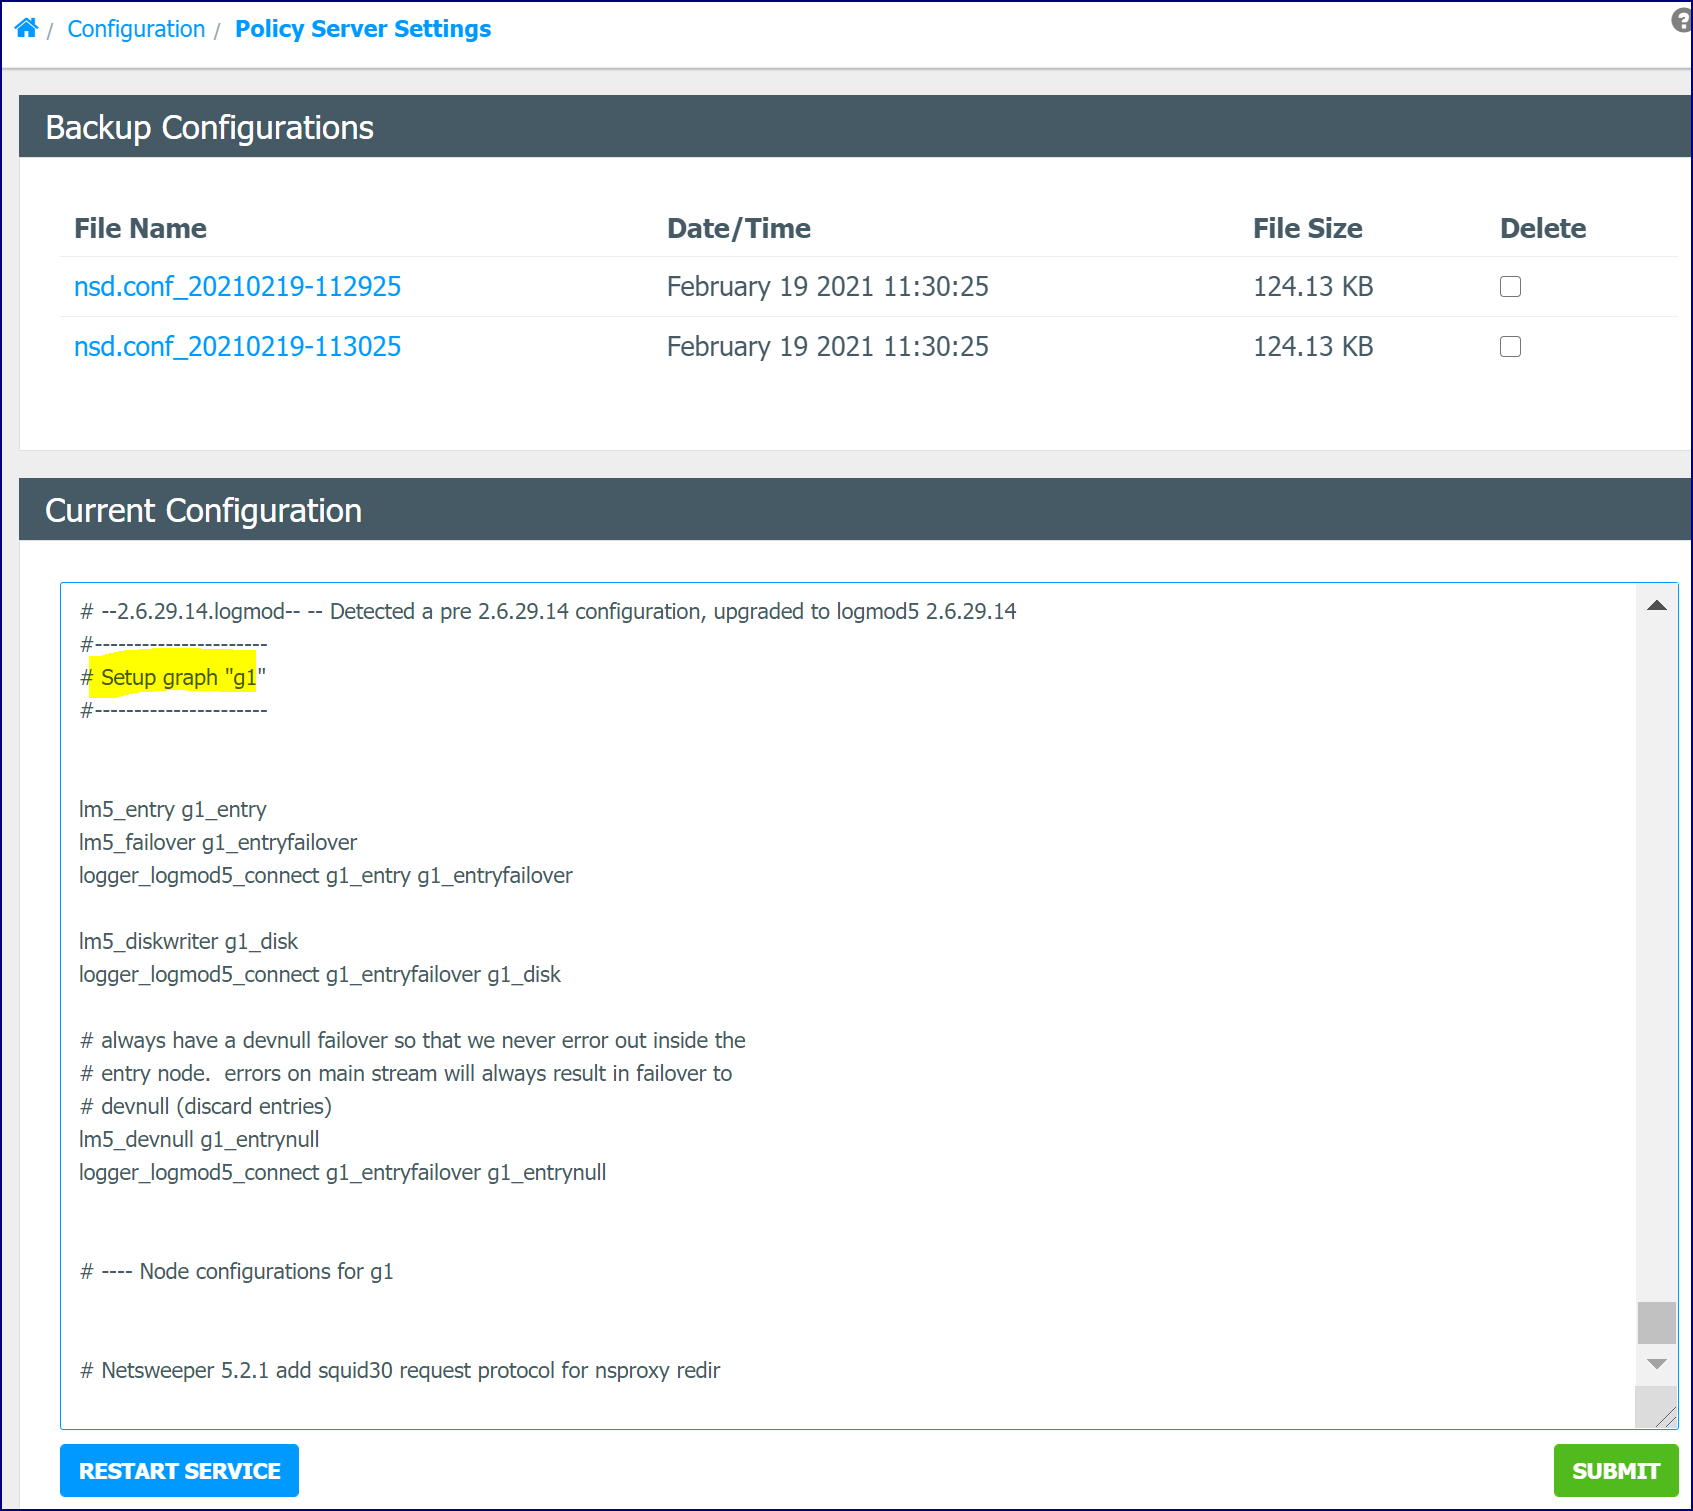
The LogMod5 framework is configured through the 'Policy Server Settings' (nsd.conf) found under Administration > Configuration. It uses the Policy Server Settings file because the logging framework is a component of the policy service.
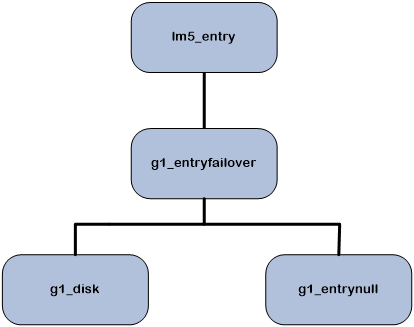
Using the nsd.conf file, the logging framework can be configured in many ways to suit your logging needs. This does, however, add complexity to the configuration of the logging framework. A view of the default configuration for LogMod5, as seen in the WebAdmin Policy Server Settings, and a diagram of the resulting LogMod5 graph, is shown below.
Incoming Logging Packets
The LogMod5 service, a component of the policy service, receives two distinct types of logging packets.
-
Local logging packets
-
These are logging packets received from the local policy service, in which LogMod5 is instantiated.
-
-
Remote logging packets
-
These are remote logging packets received from a remote policy service.
-
LogMod5 can be configured to handle these two types of packets separately.
Outputs Logging
Outbound Ports Logging
Below is a list of outbound ports that the logging service uses.
|
Port |
Protocol |
Comments |
|---|---|---|
|
3000 |
TCP |
Remote logging packets sent to this port. |
|
3161 |
UDP |
SNMP. |
Request Logs Viewer
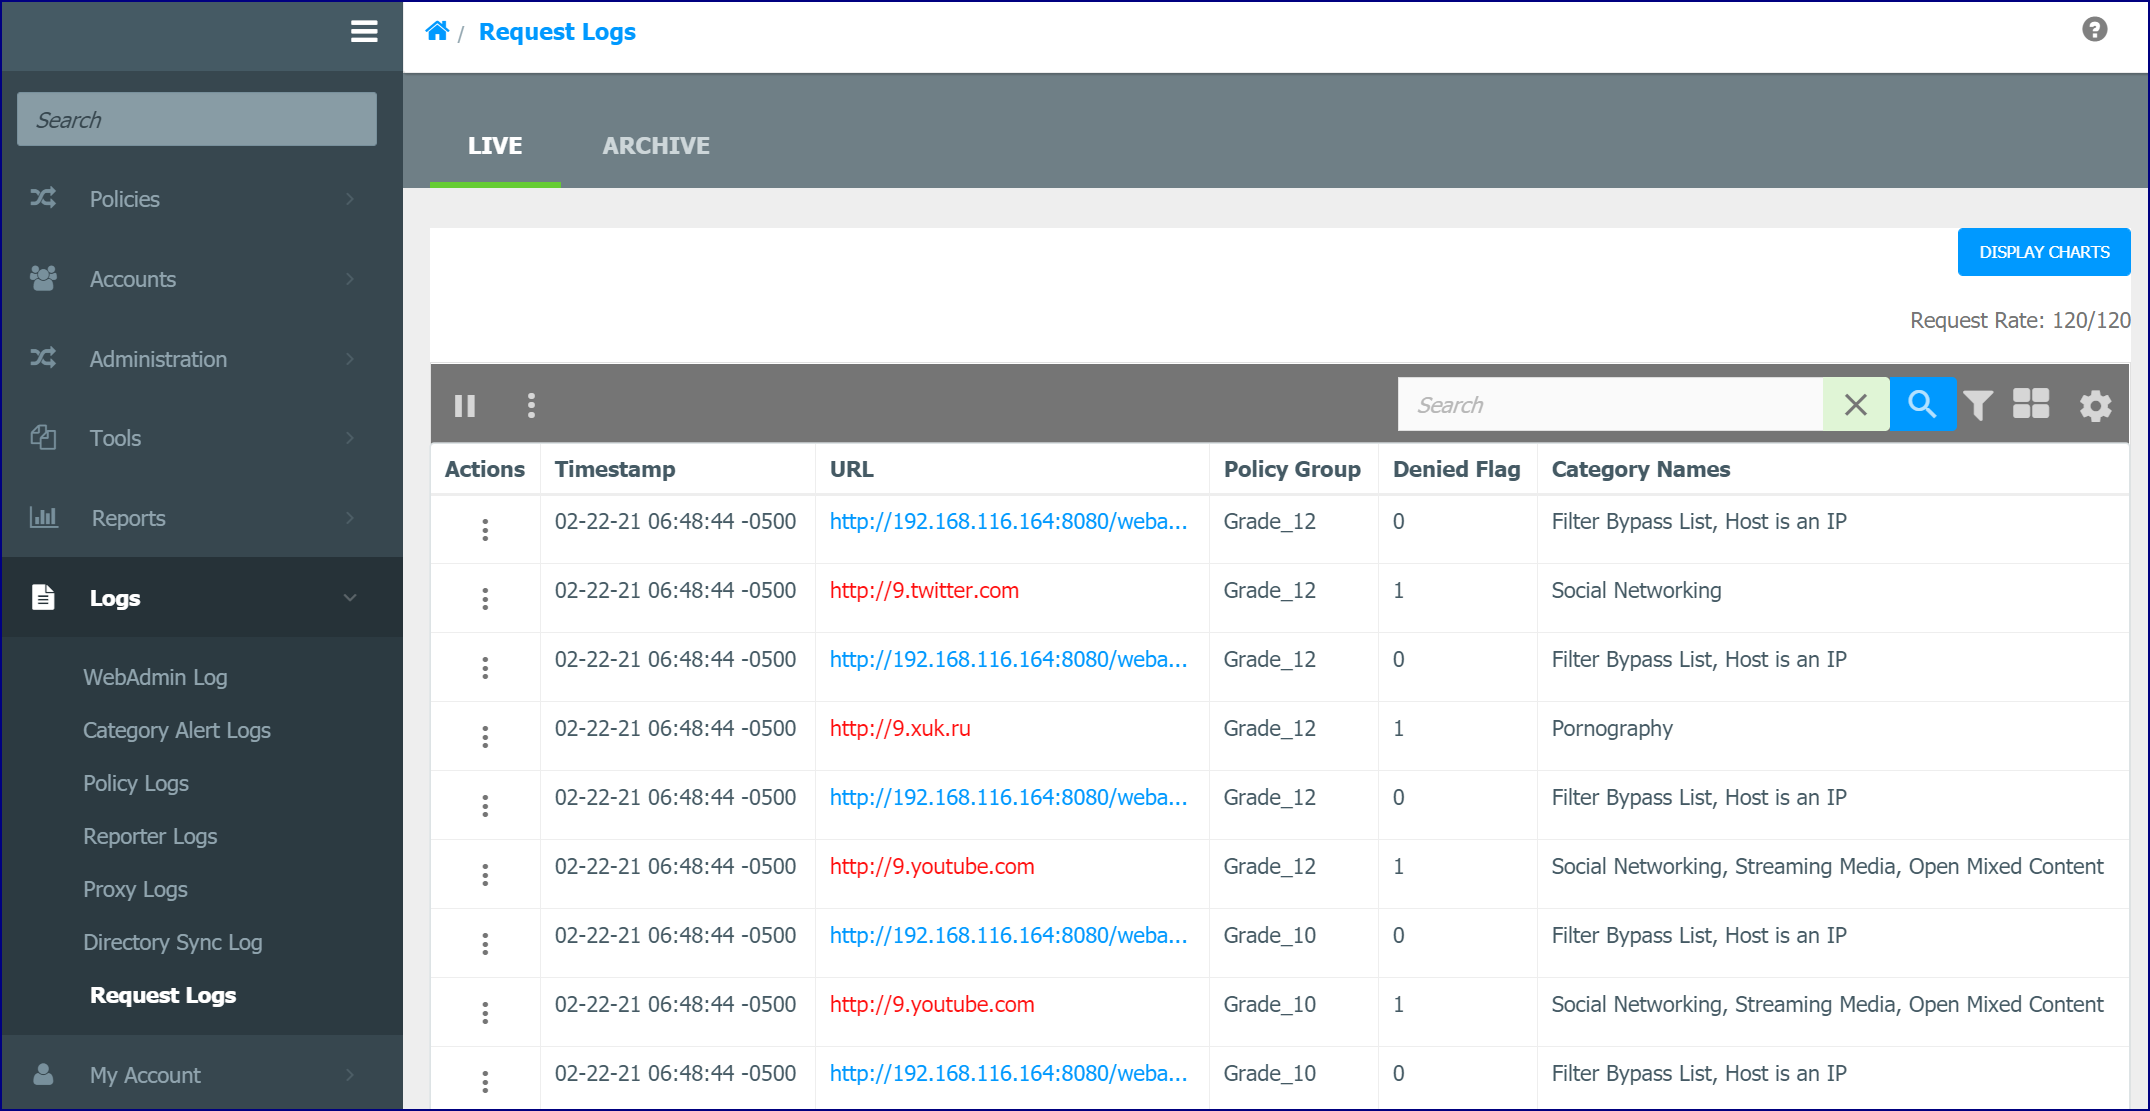
The Request Logs are typically the final destination for logging packets within the LogMod5 framework. They track all request log activity and become inputs for the Netsweeper Reporting Service.
By default, the Request Logs are located at the following location on the Netsweeper server (but can be located elsewhere if non-default configurations are used):
/usr/local/netsweeper/logs
Go to Logs > Request Logs to view the live logs being generated by the local logging service. You can filter log entries using the ‘Search’ box.
Logger Service SNMP MIBs
Any Netsweeper server provides a comprehensive set of SNMP monitoring MIBs that can be collected by an external system. MIBs provide specific operational metrics about each service that is operating on a Netsweeper service.
For logging, the following MIBs are available.
|
Option |
Description |
|---|---|
|
nsdLoggerPktsReceived |
Logger Input Packets Counter |
|
nsdLoggerPktsParseErrors |
Logger Input Packet Parse Errors Counter |
|
nsdLoggerPktsSent |
Logger Sent Packets Counter |
|
nsdLoggerPktsSendErrors |
Logger Unsuccessful Send Attempts Counter |
|
nsdLoggerRequestsLogged |
Logger Written Requests Counter |
|
nsdLoggerFileWriteErrors |
Logger File Write Errors Counter |
|
nsdLoggerRequestLogged rates |
Current Logged Requests Rate per Minute |
|
nsdLoggerRequestsLogged1MinuteRateMin |
Min Requests Logged Rate per Minute |
|
nsdLoggerRequestsLogged1MinuteRateMax |
Max Requests Logged Rate per Minute |
|
nsdLoggerRequestsLogged1MinuteRateAverage |
Average Logged Requests Rate per Minute |
|
nsdLoggerRequestsLogged5MinutesRateCurrent |
Current Logged Requests Rate per 5 Minutes |
|
nsdLoggerRequestsLogged5MinutesRateMin |
Min Logged Requests Rate per Minute |
|
nsdLoggerRequestsLogged5MinutesRateMax |
Max Logged Requests Rate per 5 Minutes |
|
nsdLoggerRequestsLogged5MinutesRateAverage |
Average Logged Requests Rate per 5 Minutes |
|
nsdLoggerRequestsLogged15MinutesRateCurrent |
Current Logged Requests Rate per 15 Minutes |
|
nsdLoggerRequestsLogged15MinutesRateMin |
Min Logged Requests Rate per 15 Minutes |
|
nsdLoggerRequestsLogged15MinutesRateMax |
Max Logged Requests Rate per 15 Minutes |
|
nsdLoggerRequestsLogged15MinutesRateAverage |
Average Logged Requests Rate per 15 Minutes |
|
nsdLoggerRequestsLogged1HourRateCurrent |
Current Logged Requests Rate per Hour |
|
nsdLoggerRequestsLogged1HourRateMin |
Min Logged Requests Rate per Hour |
|
nsdLoggerRequestsLogged1HourRateMax |
Max Logged Requests Rate per Hour |
|
nsdLoggerRequestsLogged1HourRateAverage |
Average Logged Requests Rate per Hour |
|
nsdLoggerRequestsLogged1DayRateCurrent |
Current Logged Requests Rate per Day |
|
nsdLoggerRequestsLogged1DayRateMin |
Min Logged Requests Rate per Day |
|
nsdLoggerRequestsLogged1DayRateMax |
Max Logged Requests Rate per Day |
|
nsdLoggerRequestsLogged1DayRateAverage |
Average Logged Requests Rate per Day |
|
nsdLoggerQueueAddOkayCount |
Number of log entries we added to the log processing queue |
|
nsdLoggerQueueAddFailedCount |
Number of log entries we failed to add to the log processing queue |
|
nsdLoggerQueueSoftLimitHitCount |
Number of log entries that triggers the soft limit of the queue. This means we had to signal the logging processor to process the queue |
|
nsdLoggerQueueHardLimitHitCount |
Number of log entries that triggered the hard limit. This means we had to wait for the queue to be processed |
|
nsdLoggerQueueSize |
The current size of the log processing queue |
|
nsdLoggerQueueAddStoppedDiscardCount |
Number of log records that were discarded because the logger was stopped |
|
nsdLoggerQueueAddHardLimitDiscardCount |
Number of log records that were discarded because the logger queue hit hard limit |
|
nsdLoggerQueueAddStoppedCount |
Number of times the logger was stopped |
|
nsdLoggerQueueAddDenyPageCount |
Number of requests that were server with deny page because logger had unrecoverable error |
|
nsdLoggerBytesReceived |
Logger Input Bytes Counter |
|
nsdLoggerBytesSent |
Logger Output Bytes Counter |
|
nsdLoggerConnectAttempts |
Number of attempts to connect to remote logging server(s) |
|
nsdLoggerConnectSuccess |
Number of successful attempts to connect to remote logging server(s) |
|
nsdLoggerConnectFailed |
Number of unsuccessful attempts to connect to remote logging server(s) |
|
nsdLoggerLostInSndBuf |
Number of bytes in TCP send buffer when remote closes the socket |
|
nsdLoggerDiskQueueLostBytes |
Number of bytes Lost in Disk Queue file |
|
nsdLoggerDiskQueueLostFiles |
Number of files Lost in Disk Queue |
To acquire this list of available MiBs for a Netsweeper logger, and view other useful MiBs, execute the following command:
env MIBS=ALL snmpwalk -c public -v 1 localhost:3161 enterprises
Outgoing Logging Packets
As outlined in the “Inputs” section of this document, a logging service can be configured to log remotely, meaning that it will send logging packets to another logging service on a separate machine. This is configured as part of the LogMod5 framework.
For further information on configuring LogMod5, please see ‘Configuration - LogMod5’.
Monitoring Logging
SNMP MiBs
SNMP MiBs are available for you to monitor the current state of the logging service.
For specific MiBs, please see the Outputs section of this document.
Monitoring Graphs
Within the Netsweeper WebAdmin interface are the monitoring graphs, allowing a visual view of SNMP data that is generated by the Netsweeper systems in your deployment. These can be accessed through Monitoring > Monitoring Graphs.
The available SNMP MIBs that can be monitored using the monitoring graphs are listed above, in the SNMP MIBs section.
Services Page
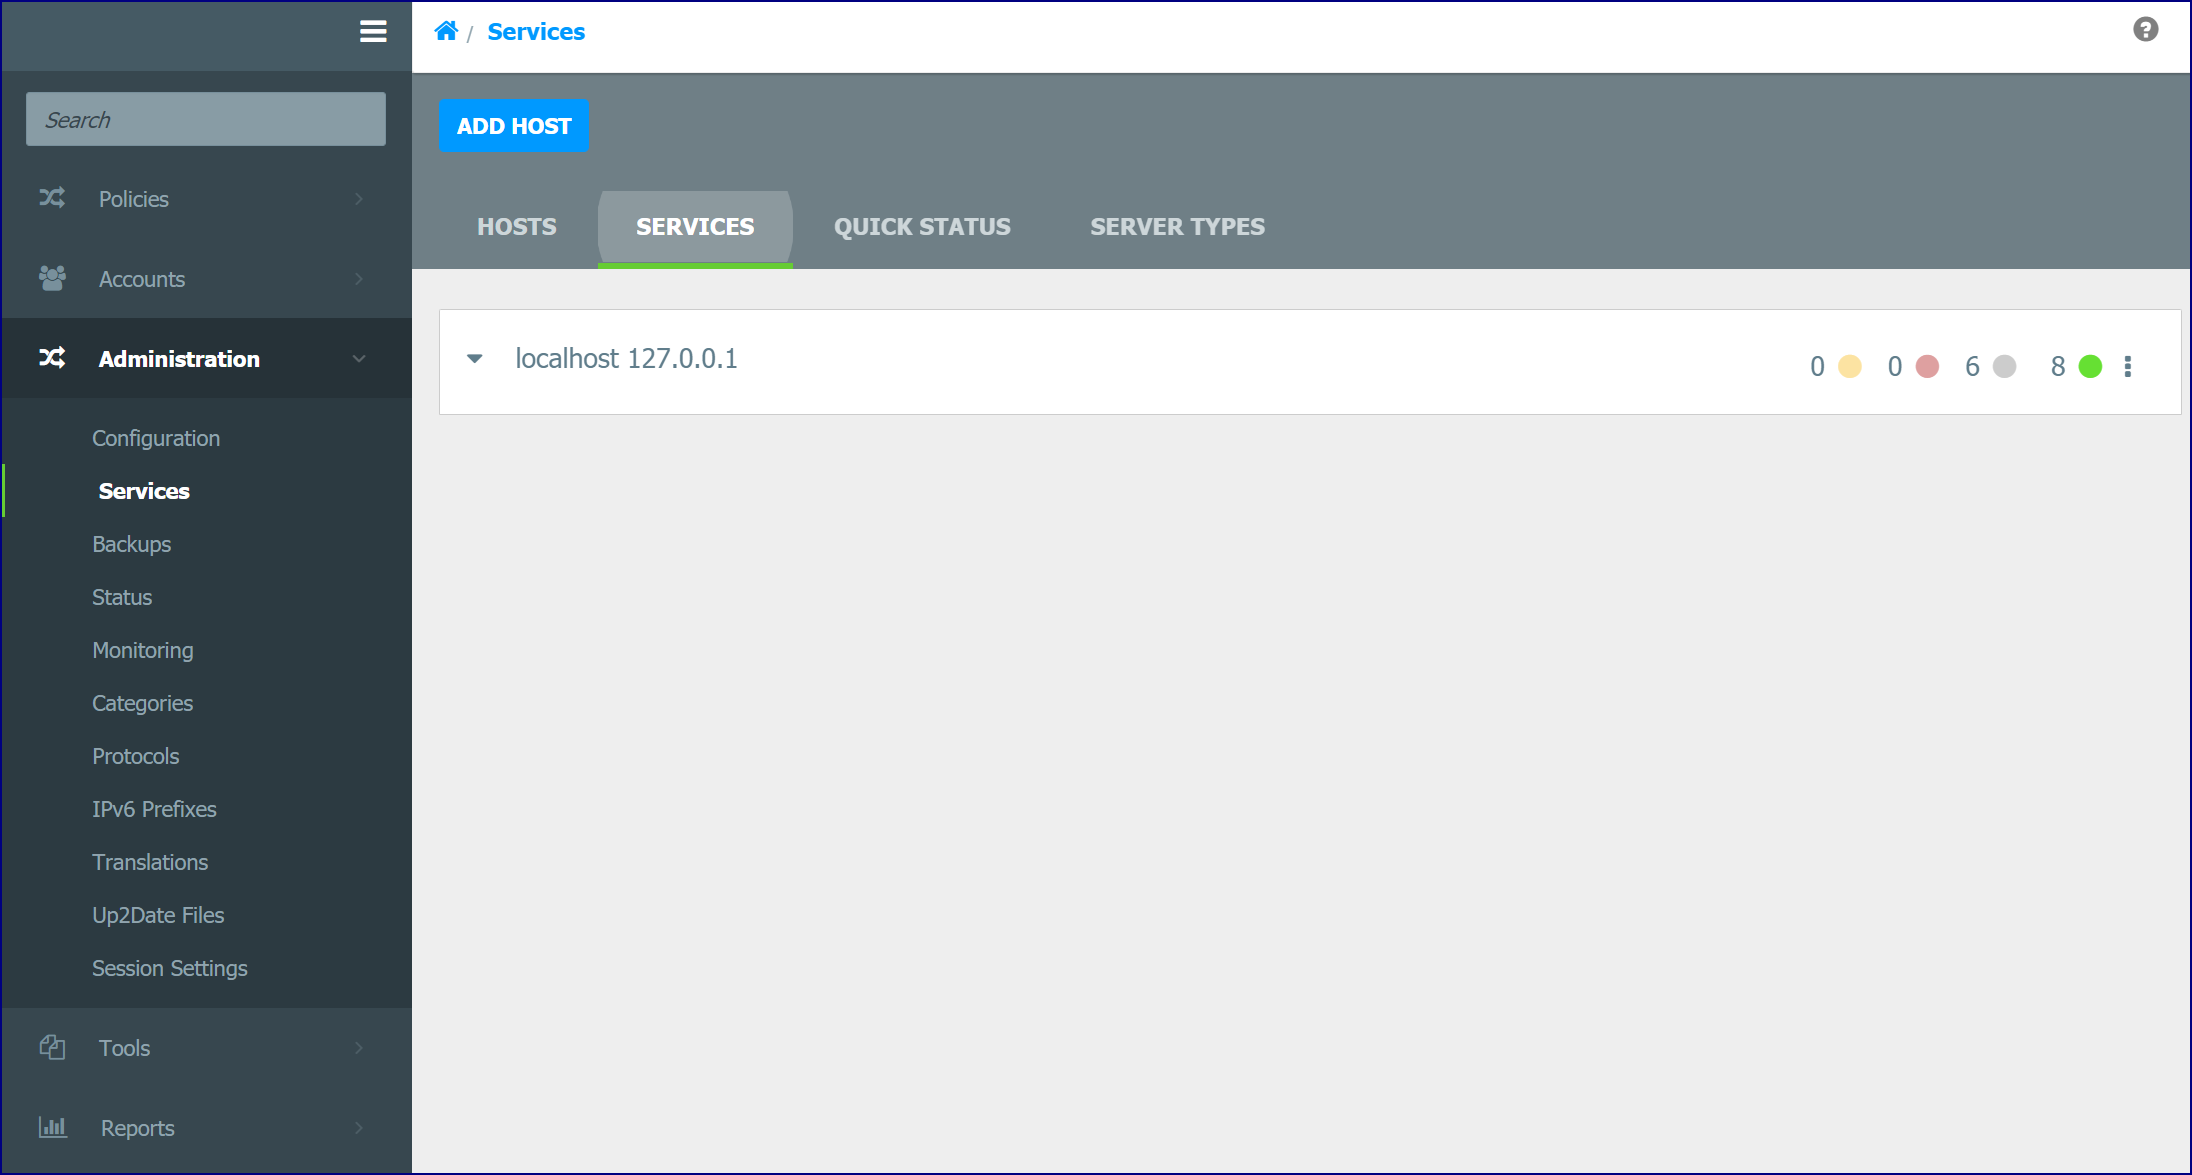
The ‘Services’ page allows for a quick, at-a-glance, view of the services running on your Netsweeper deployment. You can reach this page by browsing to Administration > Services.
Status Page
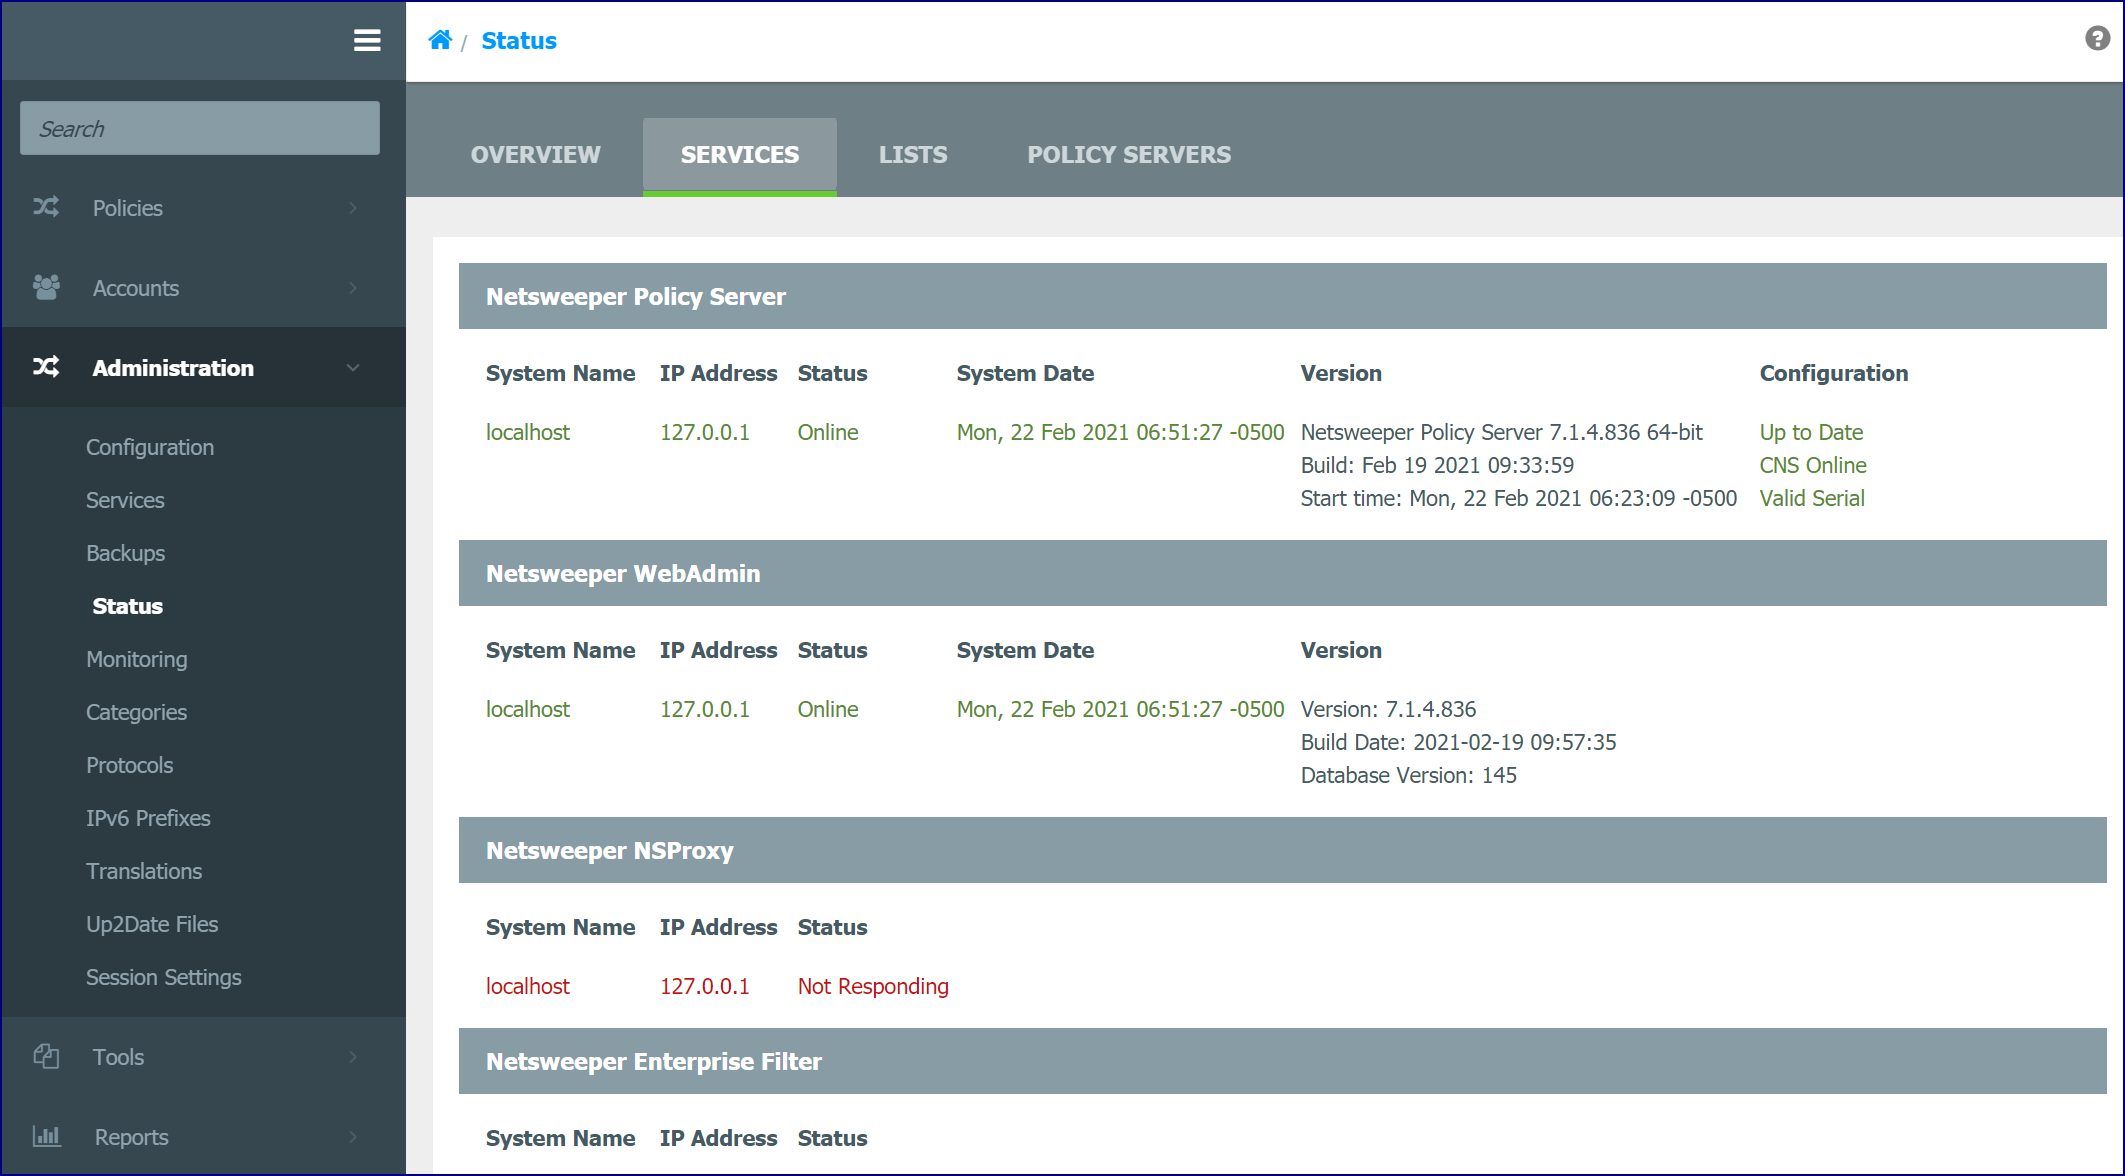
The nsd.conf (policy service configuration file) contains settings for remote administration and is used for authentication and monitoring of system status in the WebAdmin. You must list the servers by IP address or subnets that can connect. If you add the IP address of 0.0.0.0 all servers will be allowed to connect.
In WebAdmin, to view the status and statistics for the remote systems and services, go to Administration> Status and click on the Services tab.
Logging Field Descriptions
This section contains a description for logging fields. See also ‘Flexible Logging’ below for more information.
Binary Log Format
Binary Log format file has fields:
-
Date/Time (Unix timestamp)
-
Client IP
-
Client name
-
Client Group name
-
Categories
-
Denied Flag
-
Request URL
The Categories field here includes all categories if the request was allowed but only Denied categories if the request was denied.
The Denied Flag is 1 for denied requests and 0 for allowed requests.
The Binary Log format can keep only IPv4 in Client IP field.
Text Log Format
The Text Format is flexible since release 4.0.1. It means that only Date/Time field is always written but all other fields can be added or removed with configuration settings (see below about Flexible Logging). By default, the Text Log Format includes fields:
-
Date/Time (Unix timestamp)
-
Request URL
-
Client IP
-
Client name
-
Client Group name
-
Denied Flag
-
Denied Categories
-
All Categories
The Denied Flag is 1 for denied requests and 0 for allowed requests.
The Text Log format can keep both IPv4 and IPv6 in Client IP field.
In IP address fields, such as Client IP, Destination IP and Interceptor IP (the first one is a default field and other two fields are optional for this format).
Extended Binary Log Format
The Text Format is flexible. It means that only Date/Time field is always written but all other fields can be added or removed with configuration settings (see below about Flexible Logging). By default, the Extended Binary Log Format includes fields:
Extended Binary Log format has fields:
-
Date/Time (Unix timestamp)
-
Client name
-
Client Group name
-
Denied Categories
-
All Categories
-
Denied Flag
-
Request URL
-
Client IP
-
Destination IP
Table of Optional Fields
Two fields are optional. They are not included by default but can be added through the ‘Enabled Data Fields’ option under ‘Reports Settings’ in ‘WebAdmin Settings’.
|
Field |
Description |
|---|---|
|
Interceptor IP |
The address of the host that captured the request (workstation with Client Filter, squid cache server, Netsweeper server with a Capture Module). This field allows to distinguish multiple interceptors |
|
Policy Server ID |
This field allows you to distinguish multiple Policy Servers logging remotely to one Logger Server. The field contains some configurable identifiers of the Policy Server that processed the request and sent the log record to the Logging Server. |
There are some logger fields that are not logged by default into any format log file. But they can be added with Flexible Logging configuration settings (see below):
-
Interceptor IP
-
Policy Server ID
-
HTTP Method
-
User Agent
-
Referrer
-
Policy Name
The Denied Flag is 1 for denied requests and 0 for allowed requests.
The Extended Binary Log format can keep both IPv4 and IPv6 addresses for each IP field (Client IP, Destination IP, and Interceptor IP)
Flexible Logging
There are common settings that define field lists for remote logging, text logs and extended binary logs. These are defined in the 'Request Log Record Fields' section found in Policy Server Settings (nsd). They allow you to specify request log record fields that should be written to log files or sent to a remote logger server.
Request Log Record Fields Settings in NSD
Below is the setting information in the Policy Server Settings.
This setting allows you to specify request log record’s parts (record fields) that should be written to log files or sent to a remote logger server. This global setting specifies the fields set for remote logger, text format and extended binary log files. But disk log writes can have their own settings for this field’s set.
The date/time field is the only field that is always included into any log record because it is needed for the Reporter system.
|
Available Fields |
Description |
|---|---|
|
url |
The request URL |
|
client |
The Client name |
|
group |
The Group name |
|
policy |
The Policy name |
|
ip |
The client workstation IP address |
|
dst |
The request destination server IP address |
|
denied |
The denied flag (0 if the request is allowed, 1 if request is denied) |
|
category |
Two fields: the whole list of categories that were assigned to the request the denied category if the request was denied |
|
interceptor |
The request interceptor IP address |
|
server_id |
The policy server identifier |
|
method |
The request HTTP method |
|
agent |
The HTTP request User-Agent header line |
|
referrer |
The HTTP request Referrer header line |
|
type |
The Policy Event Type |
|
data |
The Policy Event Data |
|
module |
The Module Name |
|
workstation |
The Workstation Name |
|
screenshot |
The Screenshot/Image |
|
firstname |
The Client First Name |
|
lastname |
The Client Last Name |
|
|
The Client Email |
|
orgid |
The Client Organization ID |
|
allcategories |
Only the whole list of categories that were assigned to the request (not recommended, use the 'category' field instead) |
|
deniedcategories |
Only the denied category if the request was denied, all assigned categories otherwise (not recommended, use the 'category' field instead) |
|
timestamp |
The Date/Time as Unix timestamp. It makes sense only for lm5_syslog module because all others include it implicitly. |
The table below shows synonyms for the field names.
|
Field Name |
Synonyms |
|---|---|
|
url |
|
|
client |
user |
|
group |
(no synonyms) |
|
policy |
(no synonyms) |
|
ip |
clientip, client_ip |
|
dst |
dstip, dst_ip, destinationip, destination_ip |
|
denied |
deniedflag, denied_flag |
|
category |
cat, categories, cats |
|
interceptor |
peer, peerip, peer_ip, interceptorip, interceptor_ip |
|
serverid |
serverid |
|
method |
httpmethod, http_method |
|
agent |
useragent, user_agent |
|
referrer |
Referrer |
|
type |
event_type, event |
|
data |
(no synonyms) |
|
module |
(no synonyms) |
|
workstation |
(no synonyms) |
|
screenshot image |
|
|
allcategories |
allcat, allcats, allcategory |
|
deniedcategories |
deniedcat, deniedcats, deniedcategory |
Default:
This setting doesn't have a default value but if it is not specified, each logger part uses its own defaults:
-
Remote logging sends ALL available fields
-
Text format log writer: url ip user group denied category
-
Extended binary log writer: user group category denied url ip dst
Format: logger_fields field1 field2 field3 ...
See Logger Use Cases for more information on Flexible Logging.
Disable the Request Logging Framework
This setting allows you to disable the entire request logging framework. This will disable both local and remote logging of policy requests.
Default: logger_disabled false
Format: logger_disabled [ true | false ]
Log Management Tools
This section contains information on the nslog and the nslogtruncate tool. The Netsweeper Reporter service (daemon, process, etc…) is part of the Netsweeper Policy Server.
nslog
This program allows you to check log files integrity; browse file content and search needed records, and repair binary format files.
Usage: nslog [options] <filename>
The filename must be the data filename (*.log file).
|
Option |
Description |
|---|---|
|
-c |
check the file and print file information
Usage: nslog -c filename Example: nslog -c nslogger_requests_2004-09-14T12-39-54.log |
|
-p |
display the whole file See: Help Information for the -p, -h, -t, and -f Commands below. This option is used to display/watch the log file content: -p - display the whole file -h - display N lines from the head; N is specified by -n option (default value is 10) -t - display N lines from the tail; N is specified by -n option (default value is 10) -f - watch the file and display new lines as soon as they are appended to the file |
|
-h |
display from header See: Help Information for the -p, -h, -t, and -f Commands below. |
|
-t |
display from tail |
|
-f |
watch the file size and print new records when they are appended |
|
-r |
repair the file |
|
-S |
replay the entries in the log file to the logger server |
|
-v |
show the version |
nslog Options
-t – Display Lines from the Tail
Display N lines from the tail; N is specified by -n option (default value is 10)
nslog -t -? for more help information
See: Help Information for the -p, -h, -t, and -f Commands below.
-f – Watch the file for New Appended Lines
Watch the file and display new lines as soon as they are appended to the file
nslog -f -? for more help information
See: Help Information for the -p, -h, -t, and -f Commands below.
-r – Repair the Input Binary Log File
The -r option is used to repair the input binary log file. After repair, the repair.log and repair.ndx will be generated in the current directory. In addition, delete.log and delete.ndx will be generated to hold the deleted information.
This command doesn't work for text format and extended binary format log files.
Usage: nslog -r filename
Example:
nslog -r nslogger_requests_2004-09-14T12-39-54.log
Help information: nslog -r -?
-S – Replay the Log File Content
The -S option is used to replay the log file content. This option allows you to read the entries in the log file, send to the logger server, and/or convert entries into the format defined by logger.
Help Information: nslog -S -?
The -S option is used to replay the log file content.
This option allows you to read the entries in the log file, send to the logger server, and/or convert entries into the format defined by logger.
Usage: nslog -S [ -s <IP> ] [ -P <1|2> ] [ -Z <TAGNAME> ] [ -d <filter> ] filename
Options:
-s <IP> The IP of the logger server to replay (default value is 127.0.0.1)
-P <PROTO> The version of the logger protocol. Value can be 1 or 2 (default value is 2)
-z <TAG> The log file tag in log requests sent to the logger server (no default value is set)
-d <FILTER> the filter applied to select requests from the log file to display/replay/watch
nslog -d -? for more help information (see below)
Examples:
|
Option |
Description |
|---|---|
|
nslog -S test.log |
Send the requests from test.log to the logger server 127.0.0.1 using logger protocol version 2 without tag |
|
nslog -S -s 192.168.100.100 -P 1 -z school test.log |
Send the requests from test.log to the logger server 192.168.100.100 using logger protocol version 1 with tag school |
|
nslog -S -d uri=.com test.log |
Send the requests from test.log where URI contains '.com' to the logger server 127.0.0.1 using logger protocol version 2 without tag |
-v – Show the Version
Show the version
nslog Additional Help Information
Help Information: nslog -d -?
This option can be used with -p, -h, -t and -f display/watch commands and -S replay command
Filter is a name=value pair. A filer name can have some aliases.
Filter names and aliases:
|
Option |
Description |
|---|---|
|
date, time, datetime |
Date/Time |
|
url, uri |
Request URI |
|
ip, clientip |
Client IP address |
|
user, name, client |
Client name |
|
group |
Client group |
|
policy |
Filtering policy name |
|
cats, categories |
Denied categories (all categories for allowed requests) |
|
all, allcats, allcategories |
All categories |
|
dst, dstip |
Destination IP address |
|
peer, peerip, interceptorip |
Interceptor (peer) IP address |
|
logger, loggerid |
Logger ID |
|
denied, deniedflag |
Denied flag |
|
method, httpmethod |
HTTP Method |
|
agent, useragent |
HTTP User-Agent |
|
referrer |
HTTP Referrer |
|
type |
Policy Event Type |
|
data |
Policy Event Data |
Date and time format: year-month-day-hour-minutes-seconds.
The date/time filter can be truncated to minutes, hours, days, etc. (see examples).
For backward compatibility, the utility recognizes Date/Time, Client IP and URI filters
without filter name specified.
Usage: -d <filter>
Examples:
nslog -p -d uri=.org test.log - display requests where URI contains '.org'
nslog -p -d client=user123 test.log - display requests where client name contains 'user123'
nslog -p -d ip=142.107.50.225 test.log - display requests where client IP is 142.107.50.225
nslog -p -d dstip=ff00::abcd:1234 test.log - display requests where Destination IP is ff00::abcd:1234
nslog -p -d denied=0 test.log -display only allowed request records
nslog -p -d date=2016 test.log display requests made in 2016
nslog -p -d date=2016-8-16 test.log - display requests made Aug 16, 2016
nslog -p -d date=2016-8-16-16-32 test.log - display requests made Aug 16, 2016 at 16:32
nslog -h -n20 -d 2016-12-31 test.log - the same filter as date=2016-12-31, print only 20 records from head
nslog -t -n50 -d 145.12.34.111 test.log - the same filter as ip=145.12.34.111, print only 50 records from tail
nslog -f -n0 -d microsoft test.log - watch the file and print new requests where URI contains 'microsoft'
Help Information: nslog -p, -h, -t, and -f Commands
This option is used to display/watch the log file content:
-p - display the whole file
-h - display N lines from the head; N is specified by -n option (default value is 10)
-t - display N lines from the tail; N is specified by -n option (default value is 10)
-f - watch the file and display new lines as soon as they are appended to the file
Options -h, -t and -f can be used with '-n number' option that specifies the number of lines to display.
For -f option -n specifies the initial tail size to be displayed but doesn't limit the number of new lines.
All display options can be used with '-o format' option that specifies the output line format (use -o -? for more details).
All display options can be used with '-d pattern' option that specifies a filter for log lines (use -d -? for more details).
Usage: nslog -< p|h|t|f > [ -d <filter> ] [ -n <limit> ] [ -m ] [ -u ] [ -q ] [-o <format> ] filename
Options:
-o <format> specify output format to display log lines
Help Information: nslog -o -?
-m display HTTP method name instead of number
-u display Unix timestamp instead of formatted date
-q display in quiet mode, don't display detailed information and field names
-n <limit> the number lines to display/replay/watch in the log file
-d <filter> the filter applied to select requests from the log file to display/replay/watch
Help information: nslog -d -?
Nslog Examples:
|
Option |
Description |
|---|---|
|
nslog -p |
test.log - display the whole file |
|
nslog -h |
test.log - display 10 records from header |
|
nslog -t |
test.log - display 10 records from tail |
|
nslog -f |
test.log - display 10 records from tail then wait for new lines and print new lines |
|
nslog -h |
-n20 test.log - display 20 records from header |
|
nslog -t |
-n15 test.log - display 15 records from tail |
|
nslog -f |
-n0 test.log - don't display tail lines but wait for new lines and print new lines |
|
nslog -p |
-o tiu test.log - display the whole file, show Date/Time, IP, URI for each log record |
|
nslog -t |
-o o test.log - display 10 records from tail, show Date/Time, IP, URI, Name, Group, Denied Flag and Categories for each log record |
|
nslog -p |
-d 2016-8-8 test.log - display only records with date Aug, 8 2014 |
|
nslog -h |
-n100 -d dstip=142.107.50.120 test.log - display 100 records from head with Destination IP address = 142.207.50.120 |
|
nslog -t |
-n100 -d client=johndoe test.log - display 100 records from tail with Client Name = johndoe |
|
nslog -f |
-d .xxx - watch the file but display only records with '.xxx' in URI |
Help Information: nslog -o -?
This option can be used with -p, -h, -t and -f display/watch commands
By default, nslog shows all data fields in the order they are stored in the log file. The -o option allows you to select data fields for display and specify their order. If the output field is absent in the log file, it will be displayed as ####.
Format string characters:
t - Timestamp (Date/Time)
u - URI
i - client IP address
n - client Name
g - client Group
P - filtering Policy name
f - denied Flag
c - denied Categories (all Categories if a request was not denied)
s - requested Server IP (destination IP) address
p - Peer (interceptor) IP address
l - Logger ID
a - All categories
M - HTTP Method
A - HTTP User-Agent
R - HTTP Referrer
e – Policy Event Type
d – Policy Event Data
o - Old output format, equivalent 'tuingfc' (Date/time, URI, IP, Name, Group, denied Flag, Categories)
Usage: -o format_string
Examples:
nslog -p -oo nslogger_requests_2004-09-14T12-39-54.log - output: Date/Time, URI, client IP, Name, Group, denied Flag, Categories
nslog -p -otisu nslogger_requests_2004-09-14T12-39-54.log - output: Date/Time, client IP, destination IP, URI
nslogtruncate - Netsweeper Log File Truncator
This program will truncate a .log or .ndx log file for the Netsweeper logging system by a specific number of records.
Usage:
nslogtruncate <filename> <number of log records to truncate>
|
Option |
Description |
|---|---|
|
-f |
The logfile to truncate (.ndx or .log, must have both .ndx and .log) |
|
-n |
The number of log records to truncate
|
nsdctl: Logger Service from the CLI
Use these commands below to manage the policy (logger) service from the command line.
|
Argument |
Description |
|---|---|
|
nsdctl status |
Checks status |
|
nsdctl start |
Starts the nsd |
|
nsdctl start debug |
Starts the nsd in debug mode |
|
nsdctl stop |
Stops the nsd |
|
nsdctl restart |
Restarts the nsd |
|
chkconfig nsdctl off |
Disable (off) or enable (on) the service |
Keep in mind that starting/stopping/restarting the nsd process is also stopping the policy service. This is the primary service in any filtering architecture, so use with care.
loggertest - Netsweeper Logger Test Utility
Logger File Locations
The following file locations may be helpful in troubleshooting logging service problems.
|
Description |
File Location |
|---|---|
|
Logging service request logs output folder. |
/usr/local/Netsweeper/logs/ |
SNMP Logger Queue Stats
SNMP logger queue stats display logging errors.
|
SNMP Stat |
Description |
|---|---|
|
nsdLoggerQueueAddStoppedDiscardCount |
Number of log records that were discarded because the logger was stopped |
|
nsdLoggerQueueAddHardLimitDiscardCount |
Number of log records that were discarded because the logger queue hit hard limit |
|
nsdLoggerQueueAddStoppedCount |
Number of times the logger was stopped |
|
nsdLoggerQueueAddDenyPageCount |
Number of requests that were served with deny page because logger had unrecoverable error |